
Product
Every screen, captured from the running product
Not a mockup on this page. Each image below is the app itself, mid-crawl or after one, against a real crawl of books.toscrape.com — 120 pages, 37 failed checks, two runs to compare.
Screen by screen
Eleven lenses, a page each
This page is the tour. Each of these is the same screen taken apart — the questions it answers, what is on it, and the checks that feed it.
- UnderstandSite overviewIs this site healthy, and what moved?Open
- UnderstandIssuesThe work list, ranked by what it is worthOpen
- ExplorePagesEvery URL the crawl foundOpen
- ExploreStructureHow the site is actually shapedOpen
- ExploreCrawlabilityrobots.txt and the sitemap, read against each otherOpen
- ExploreLinksWhere this site points, and what answersOpen
- ExploreImagesEvery image, auditedOpen
- ExploreAI readinessCan an answer engine reach, parse and quote this site?Open
- MonitorChangesWhat is different since the last scanOpen
- MonitorScan historyEvery run, keptOpen
- ManageSettingsHow this site gets crawledOpen
Workspace
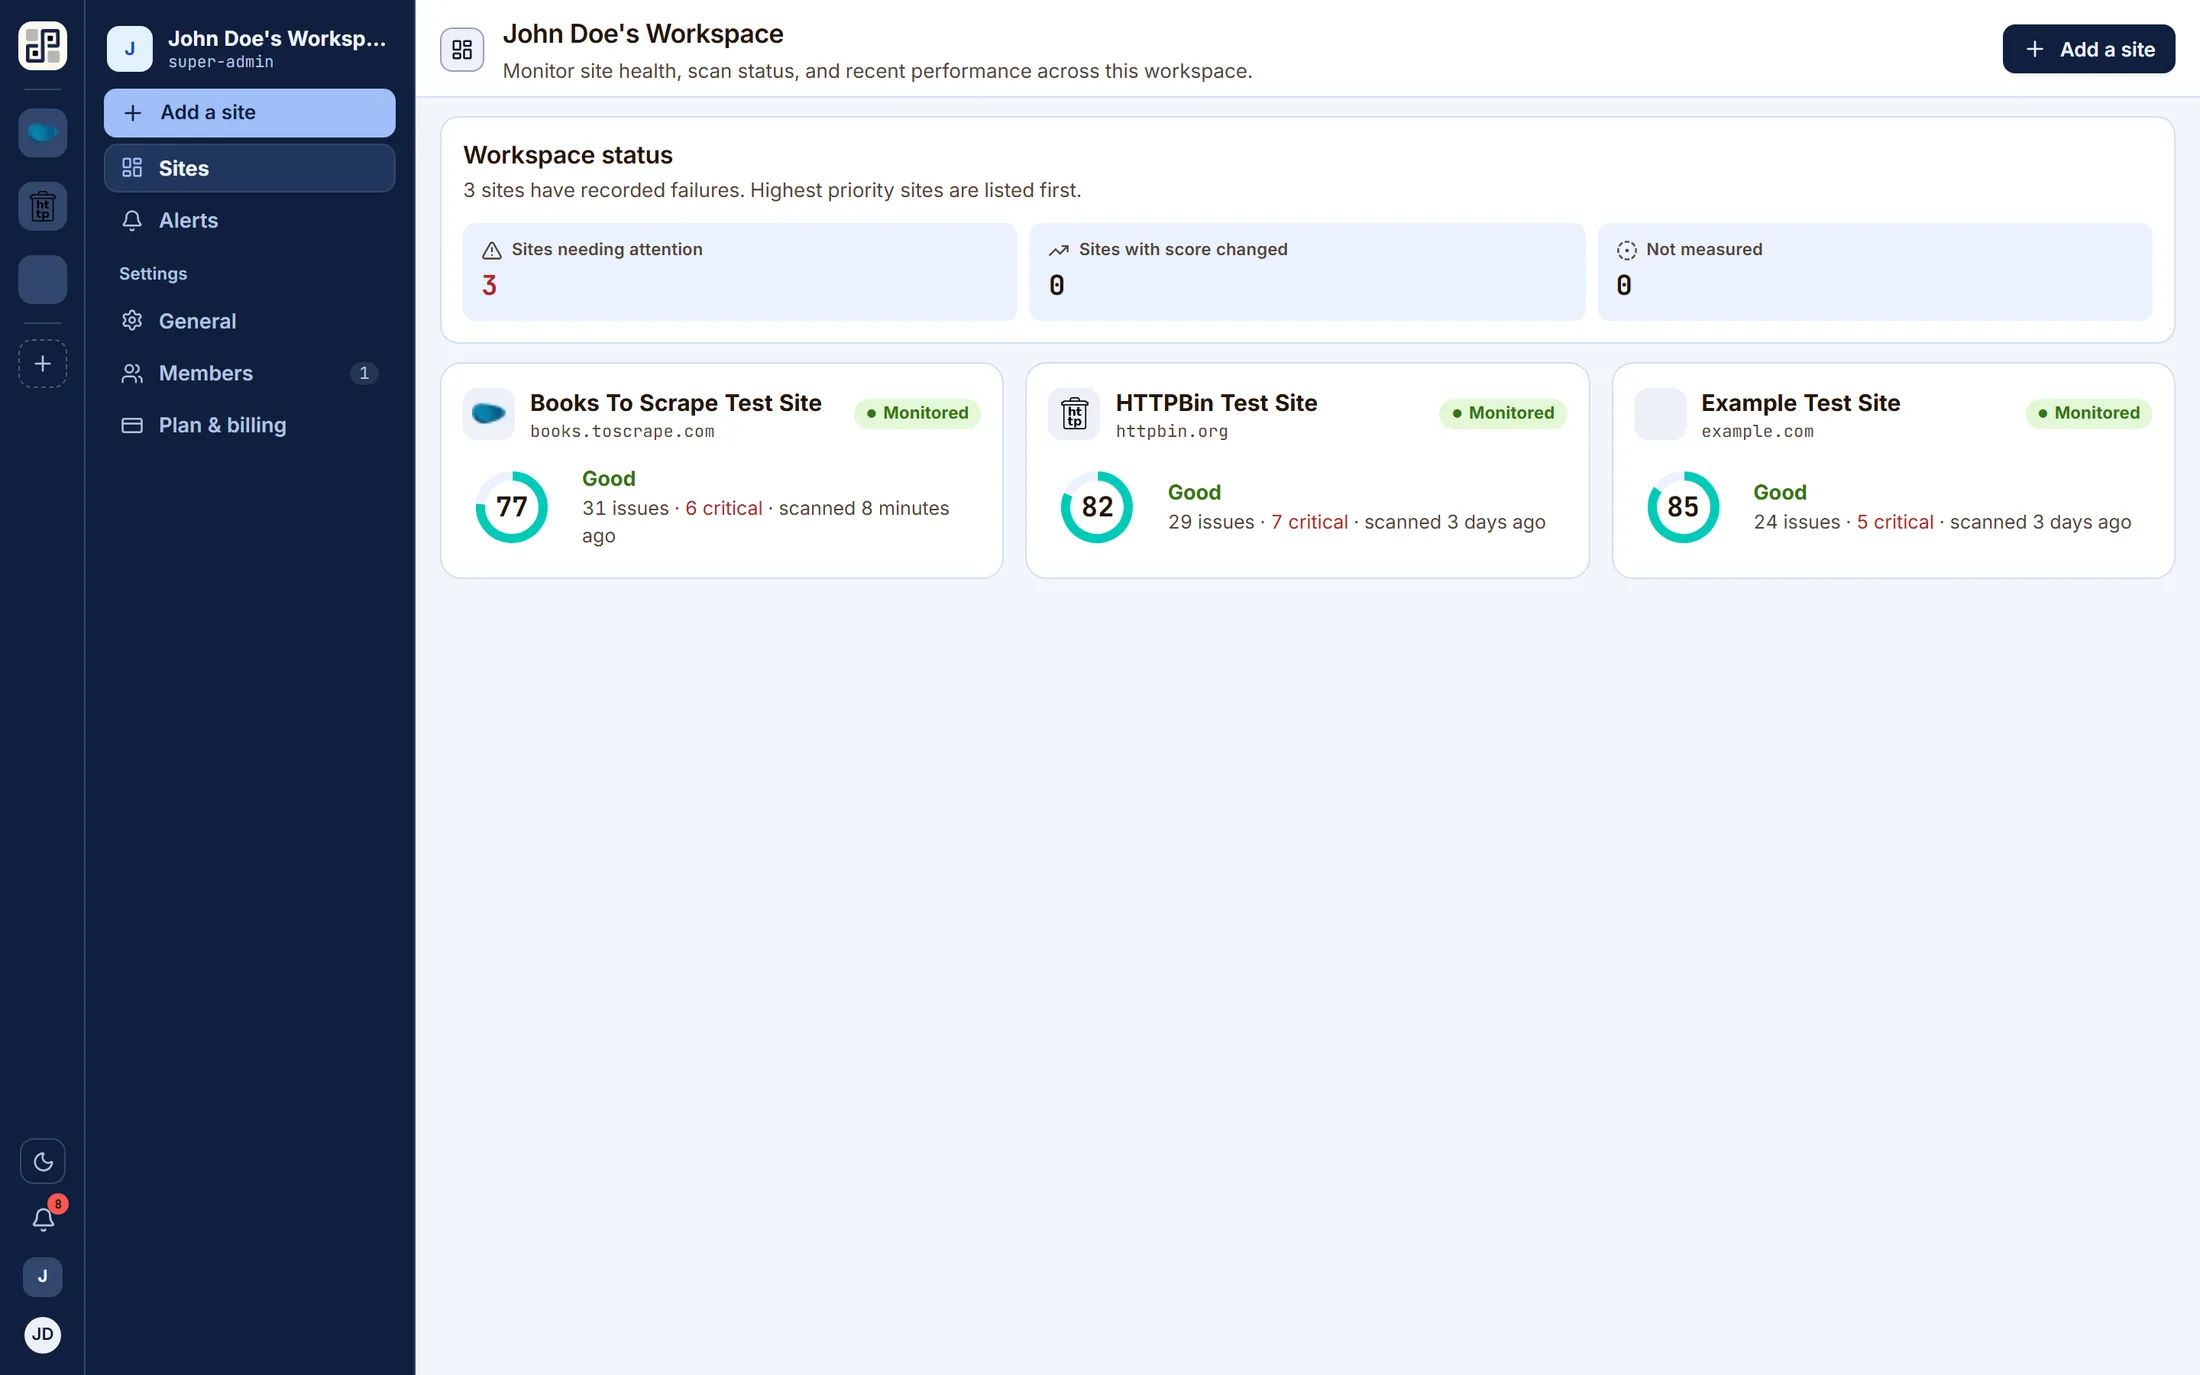
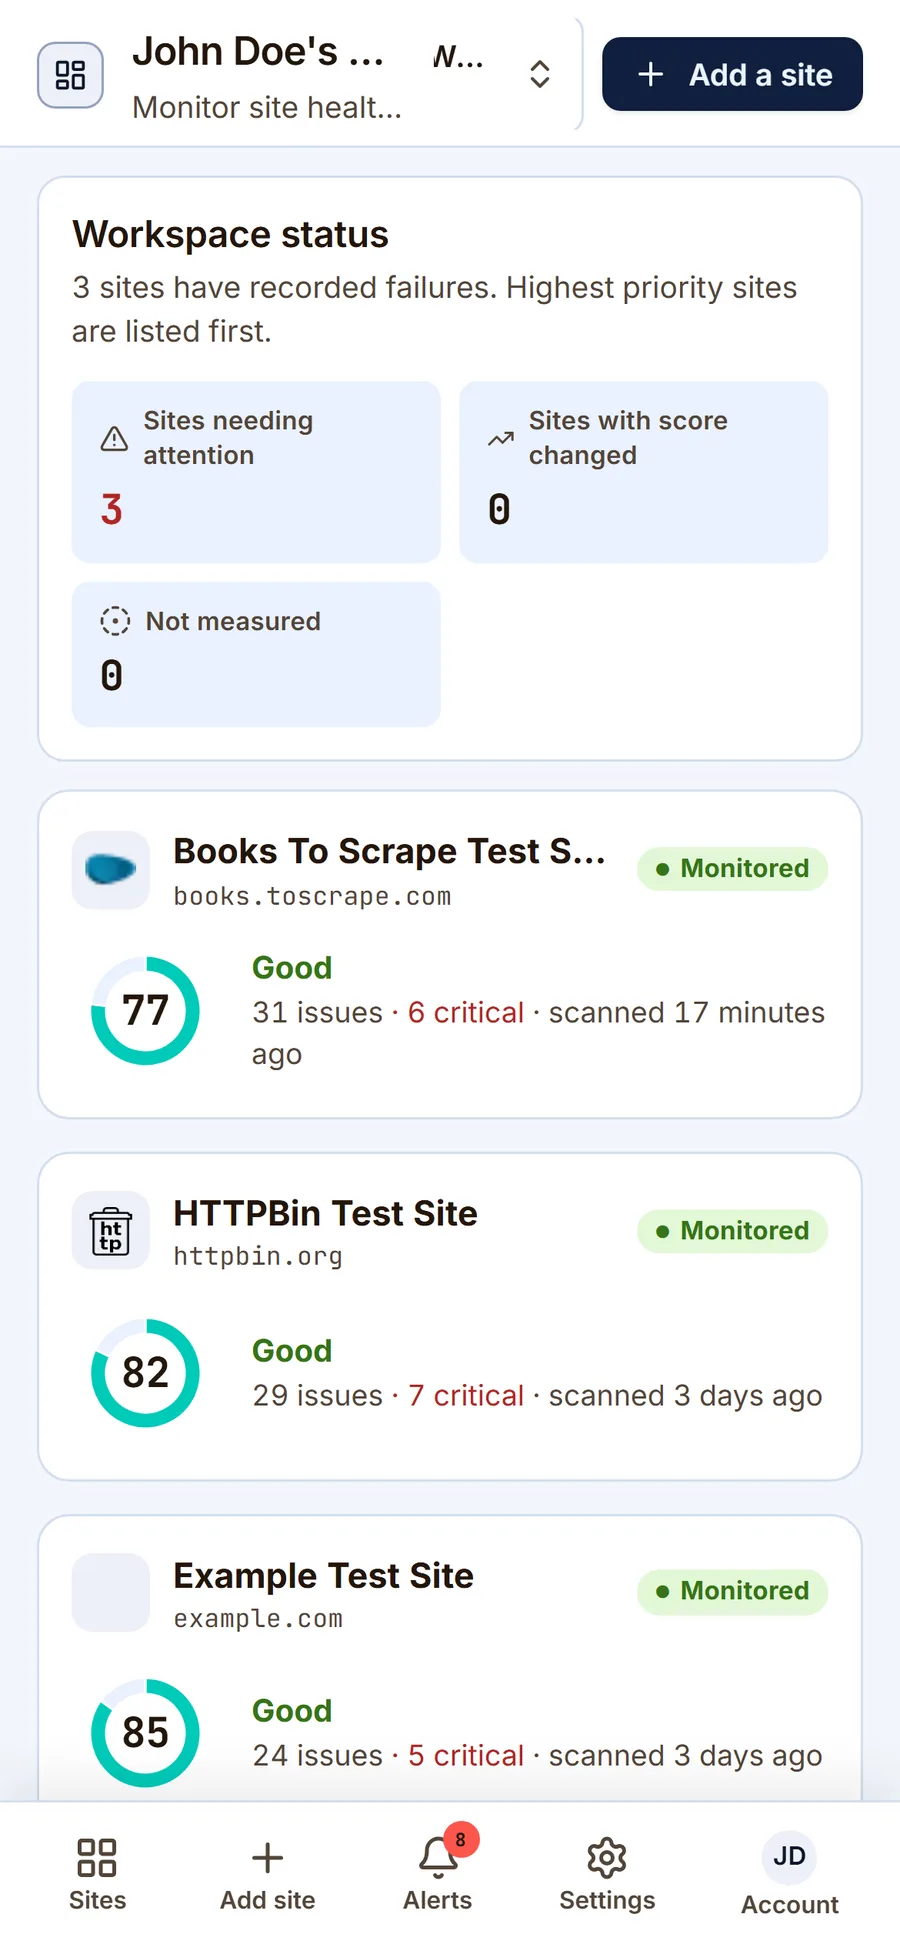
Every site you look after, worst first
A workspace holds your sites and your team. The portfolio ranks by health rather than by name, so the site that needs attention is the first thing your eye lands on — a workspace with one site at 41 and three at 98 must not look like a workspace with four at 98.
- One card per site: the score, the band it falls in, how many checks are failing and when it was last scanned.
- A status strip above them — sites needing attention, critical failing checks, and how many changed since the previous scan.
- Switch workspaces from the rail; a user can belong to several.
Site overview
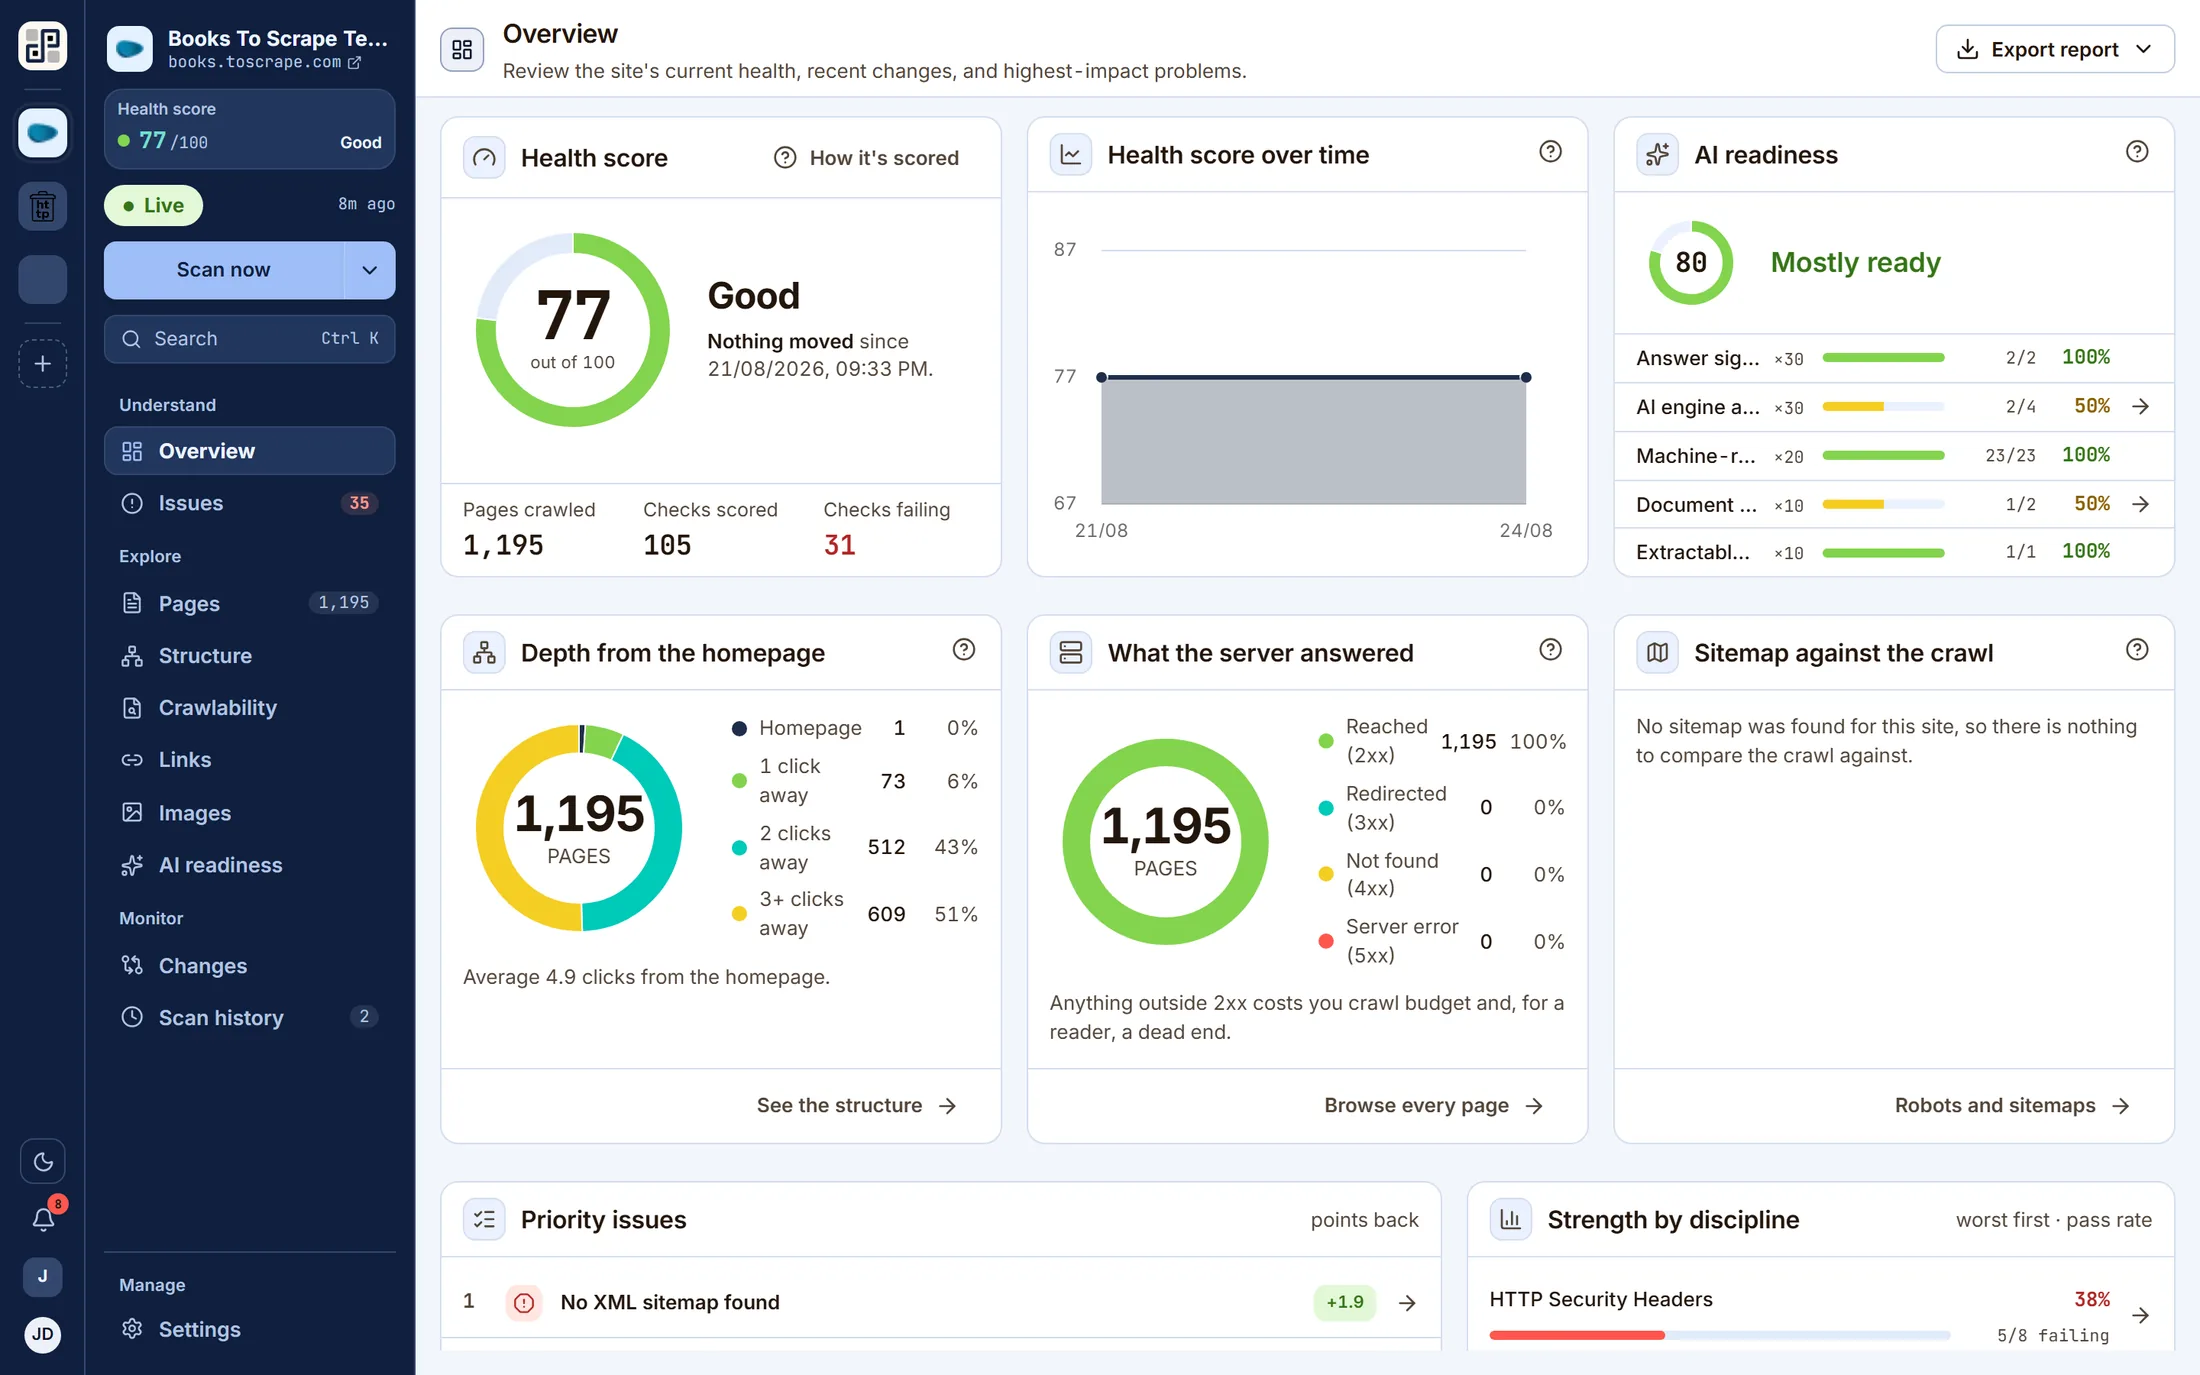
Is this site healthy, and what moved?
One screen for the whole answer: the score out of 100 with its delta and what caused it, the trend across runs, AI readiness, how deep the crawl went, what the server answered, and how the sitemap compares with what was actually reached.
- “Nothing moved since 22/08” — the delta names the change, not just the number.
- Crawl depth and response mix as donuts, because “120 of 120 reached 2xx” is a distribution, not a figure.
- Sitemap against crawl: listed-not-crawled and crawled-not-listed, side by side.
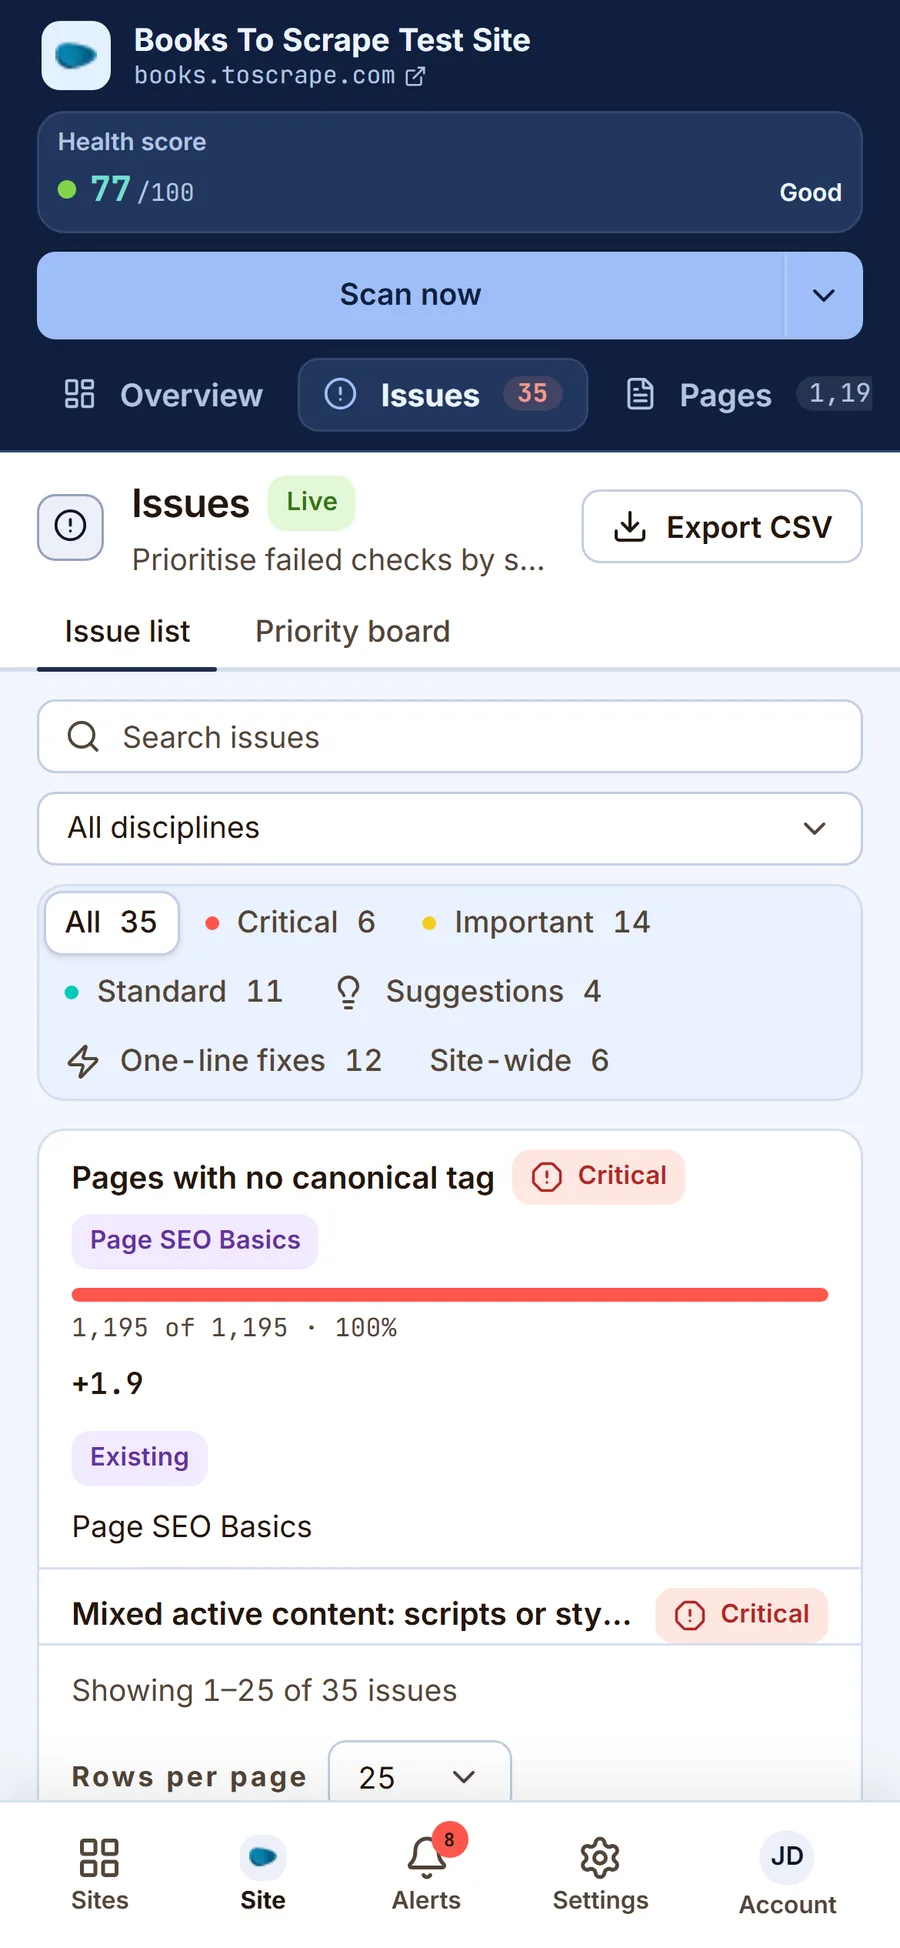
Issues
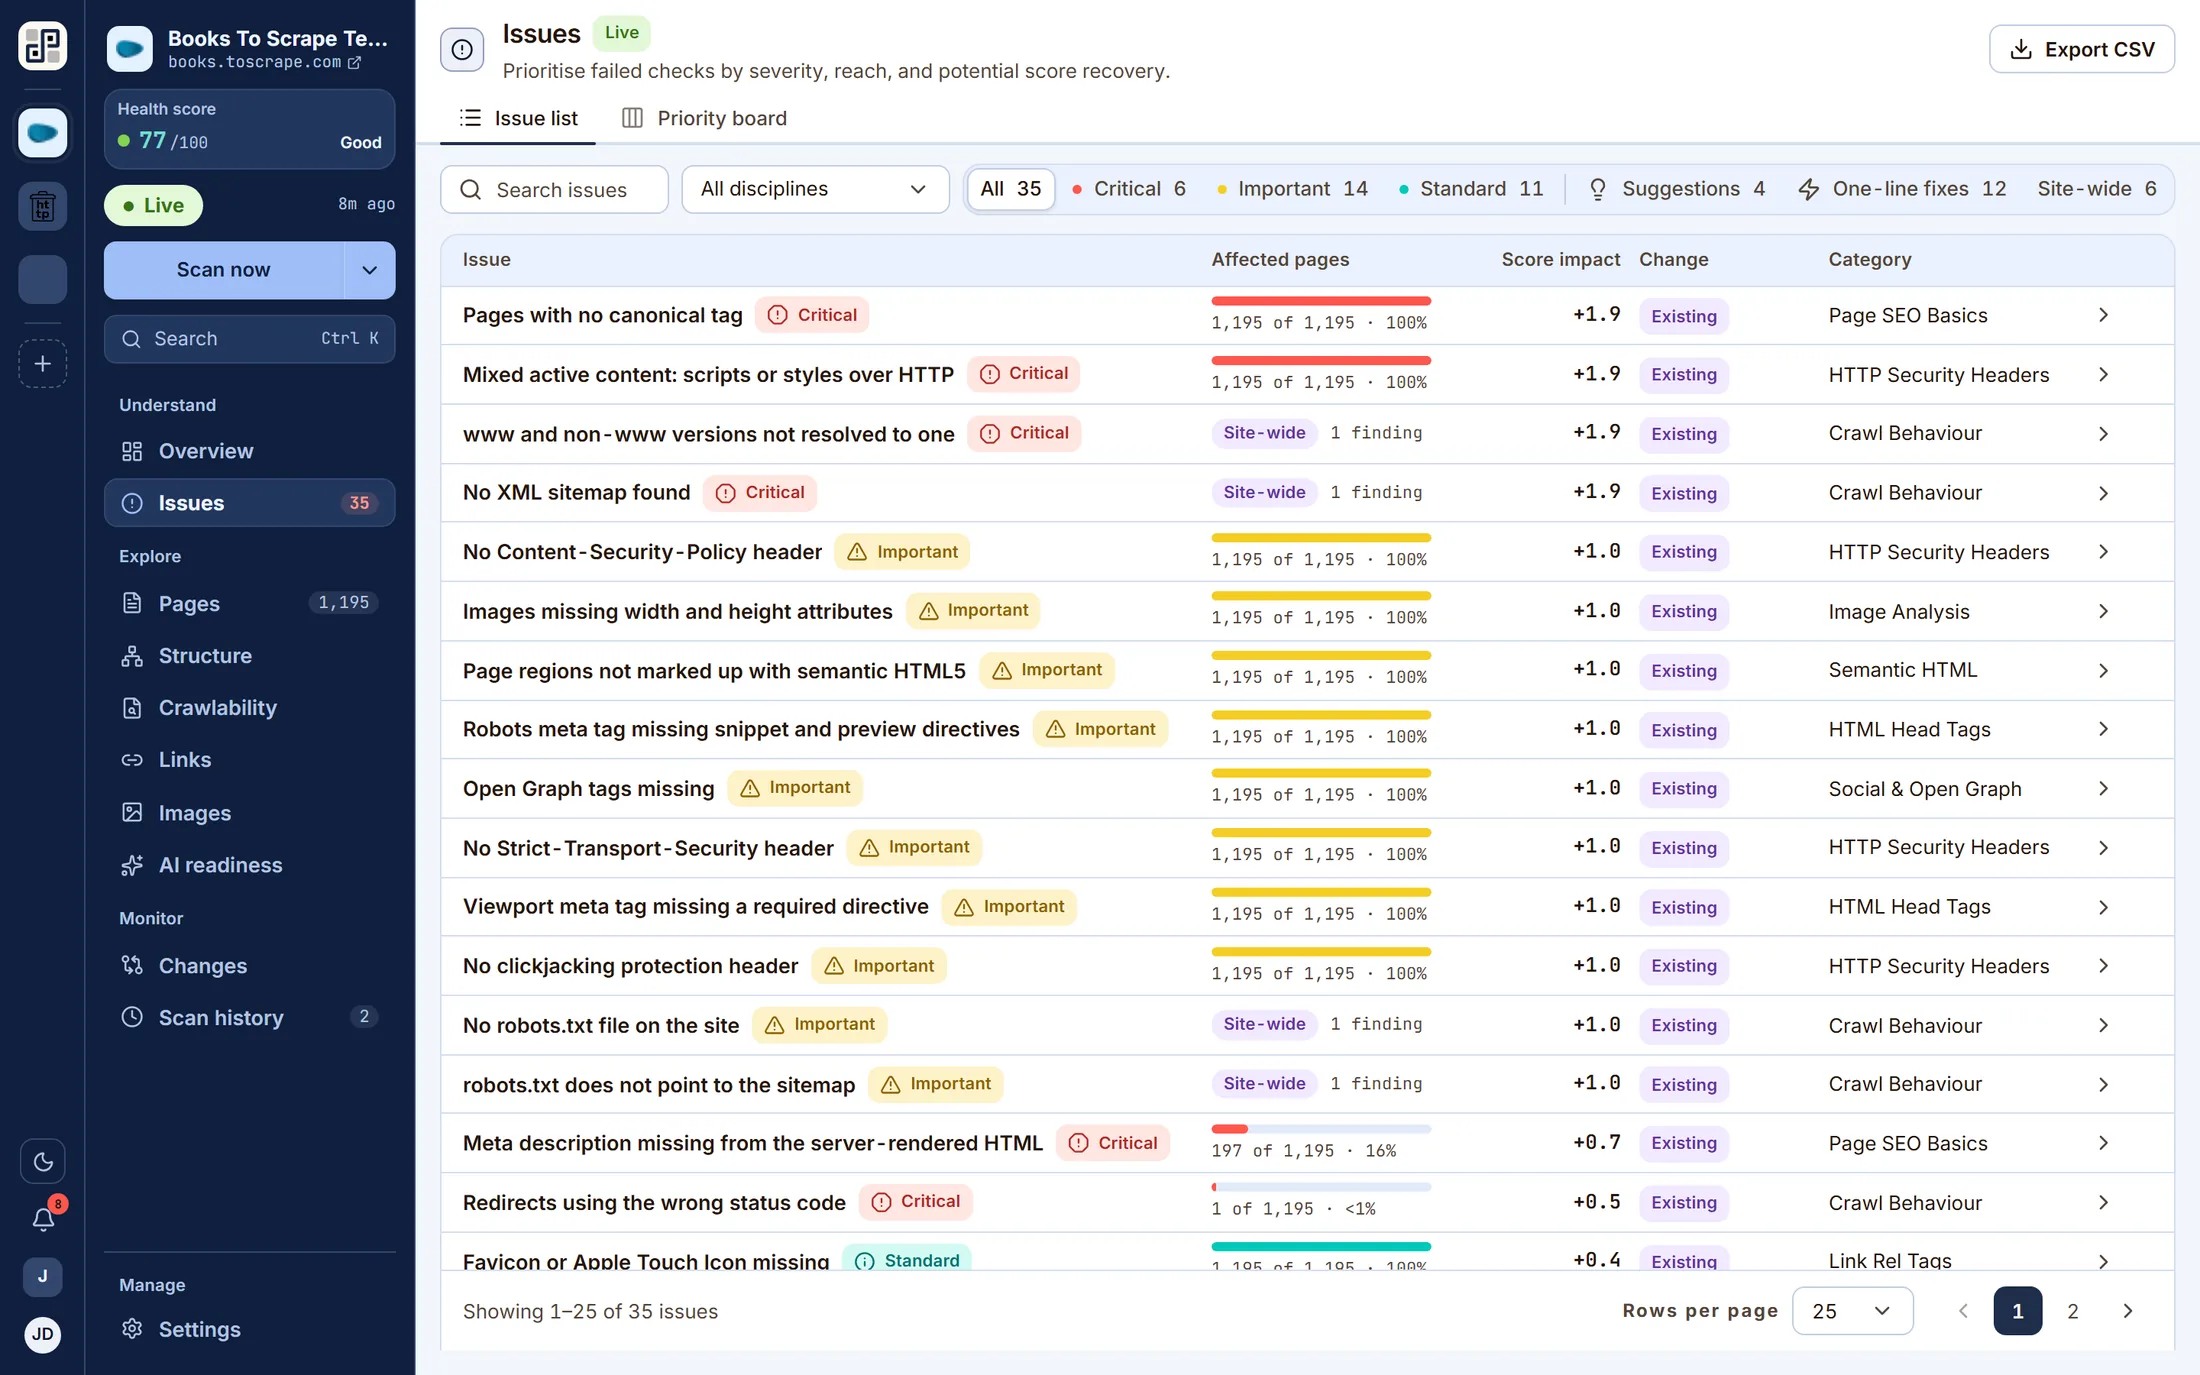
The work list, ranked by what it is worth
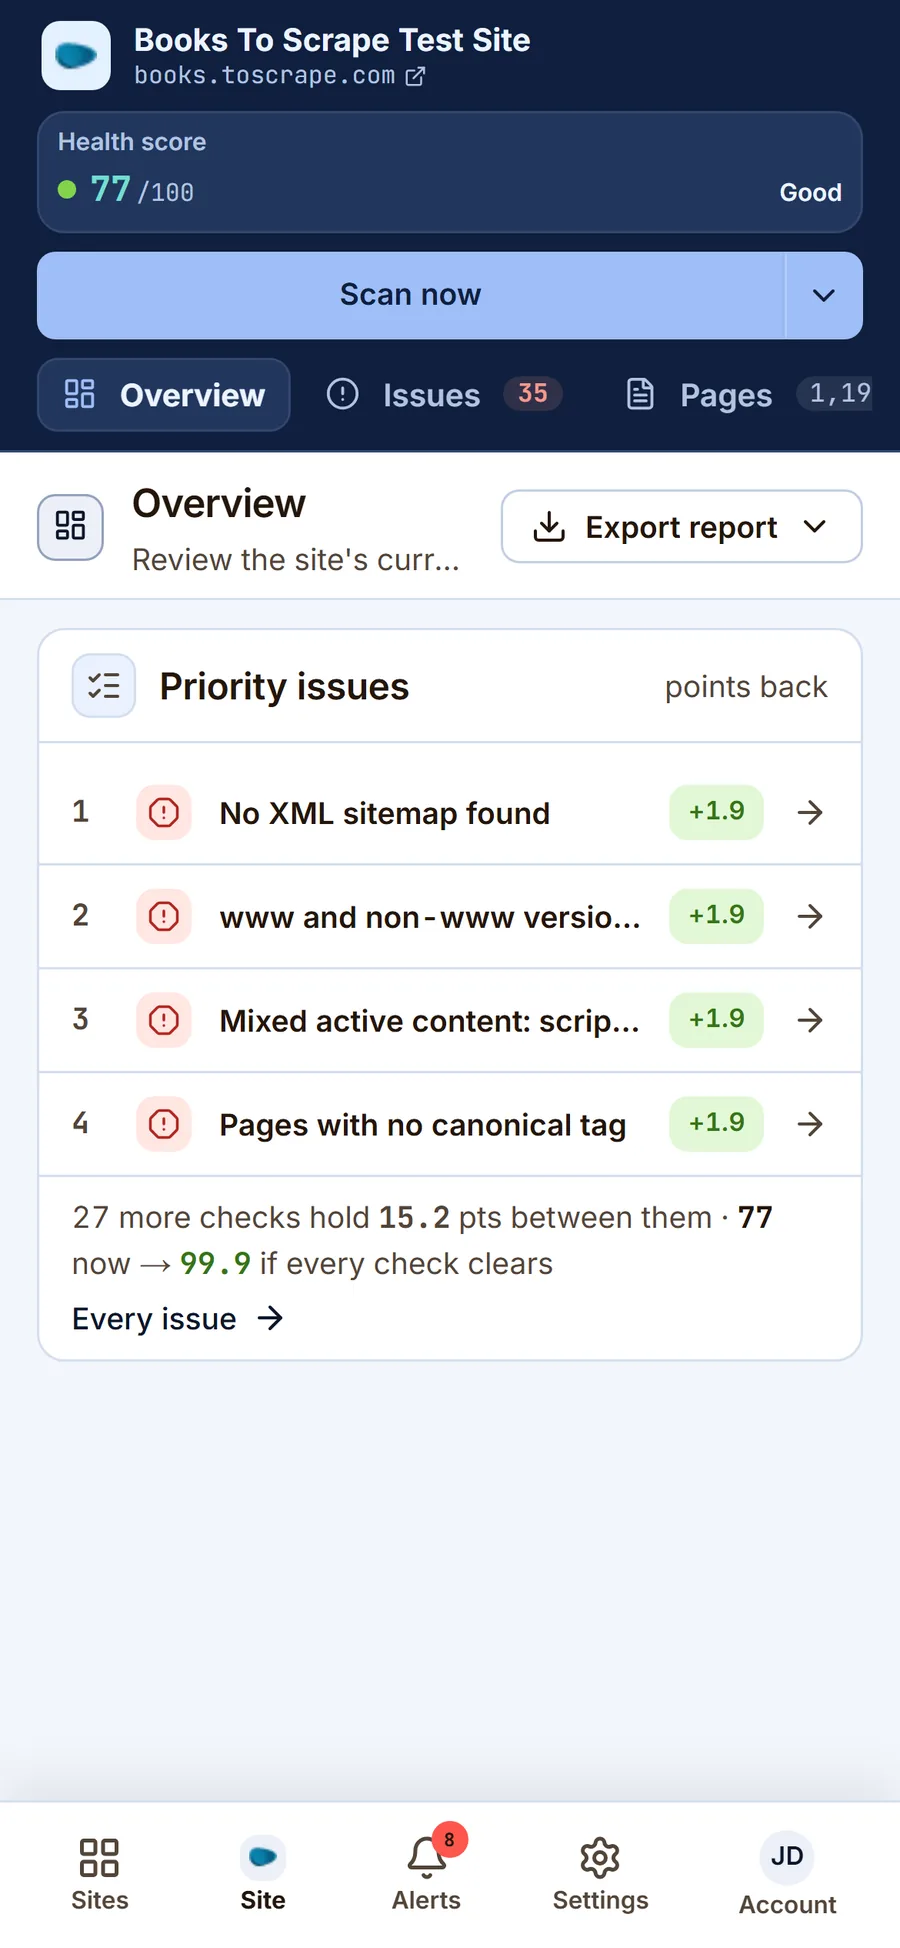
Every failed check with its severity, how many pages it reaches, and the points you get back for fixing it. Sort by biggest win first and the top of the list is the afternoon's work.
- Filter to Critical, One-line fixes, or Site-wide — three different kinds of afternoon.
- “120 of 120 · 100%” beside “55 of 120 · 46%” tells you whether a finding is systemic or a one-off before you open it.
- Every row says whether the finding is new since the last scan or was already there.
- Export the whole list to CSV, or render the run as a PDF.
Issue detail
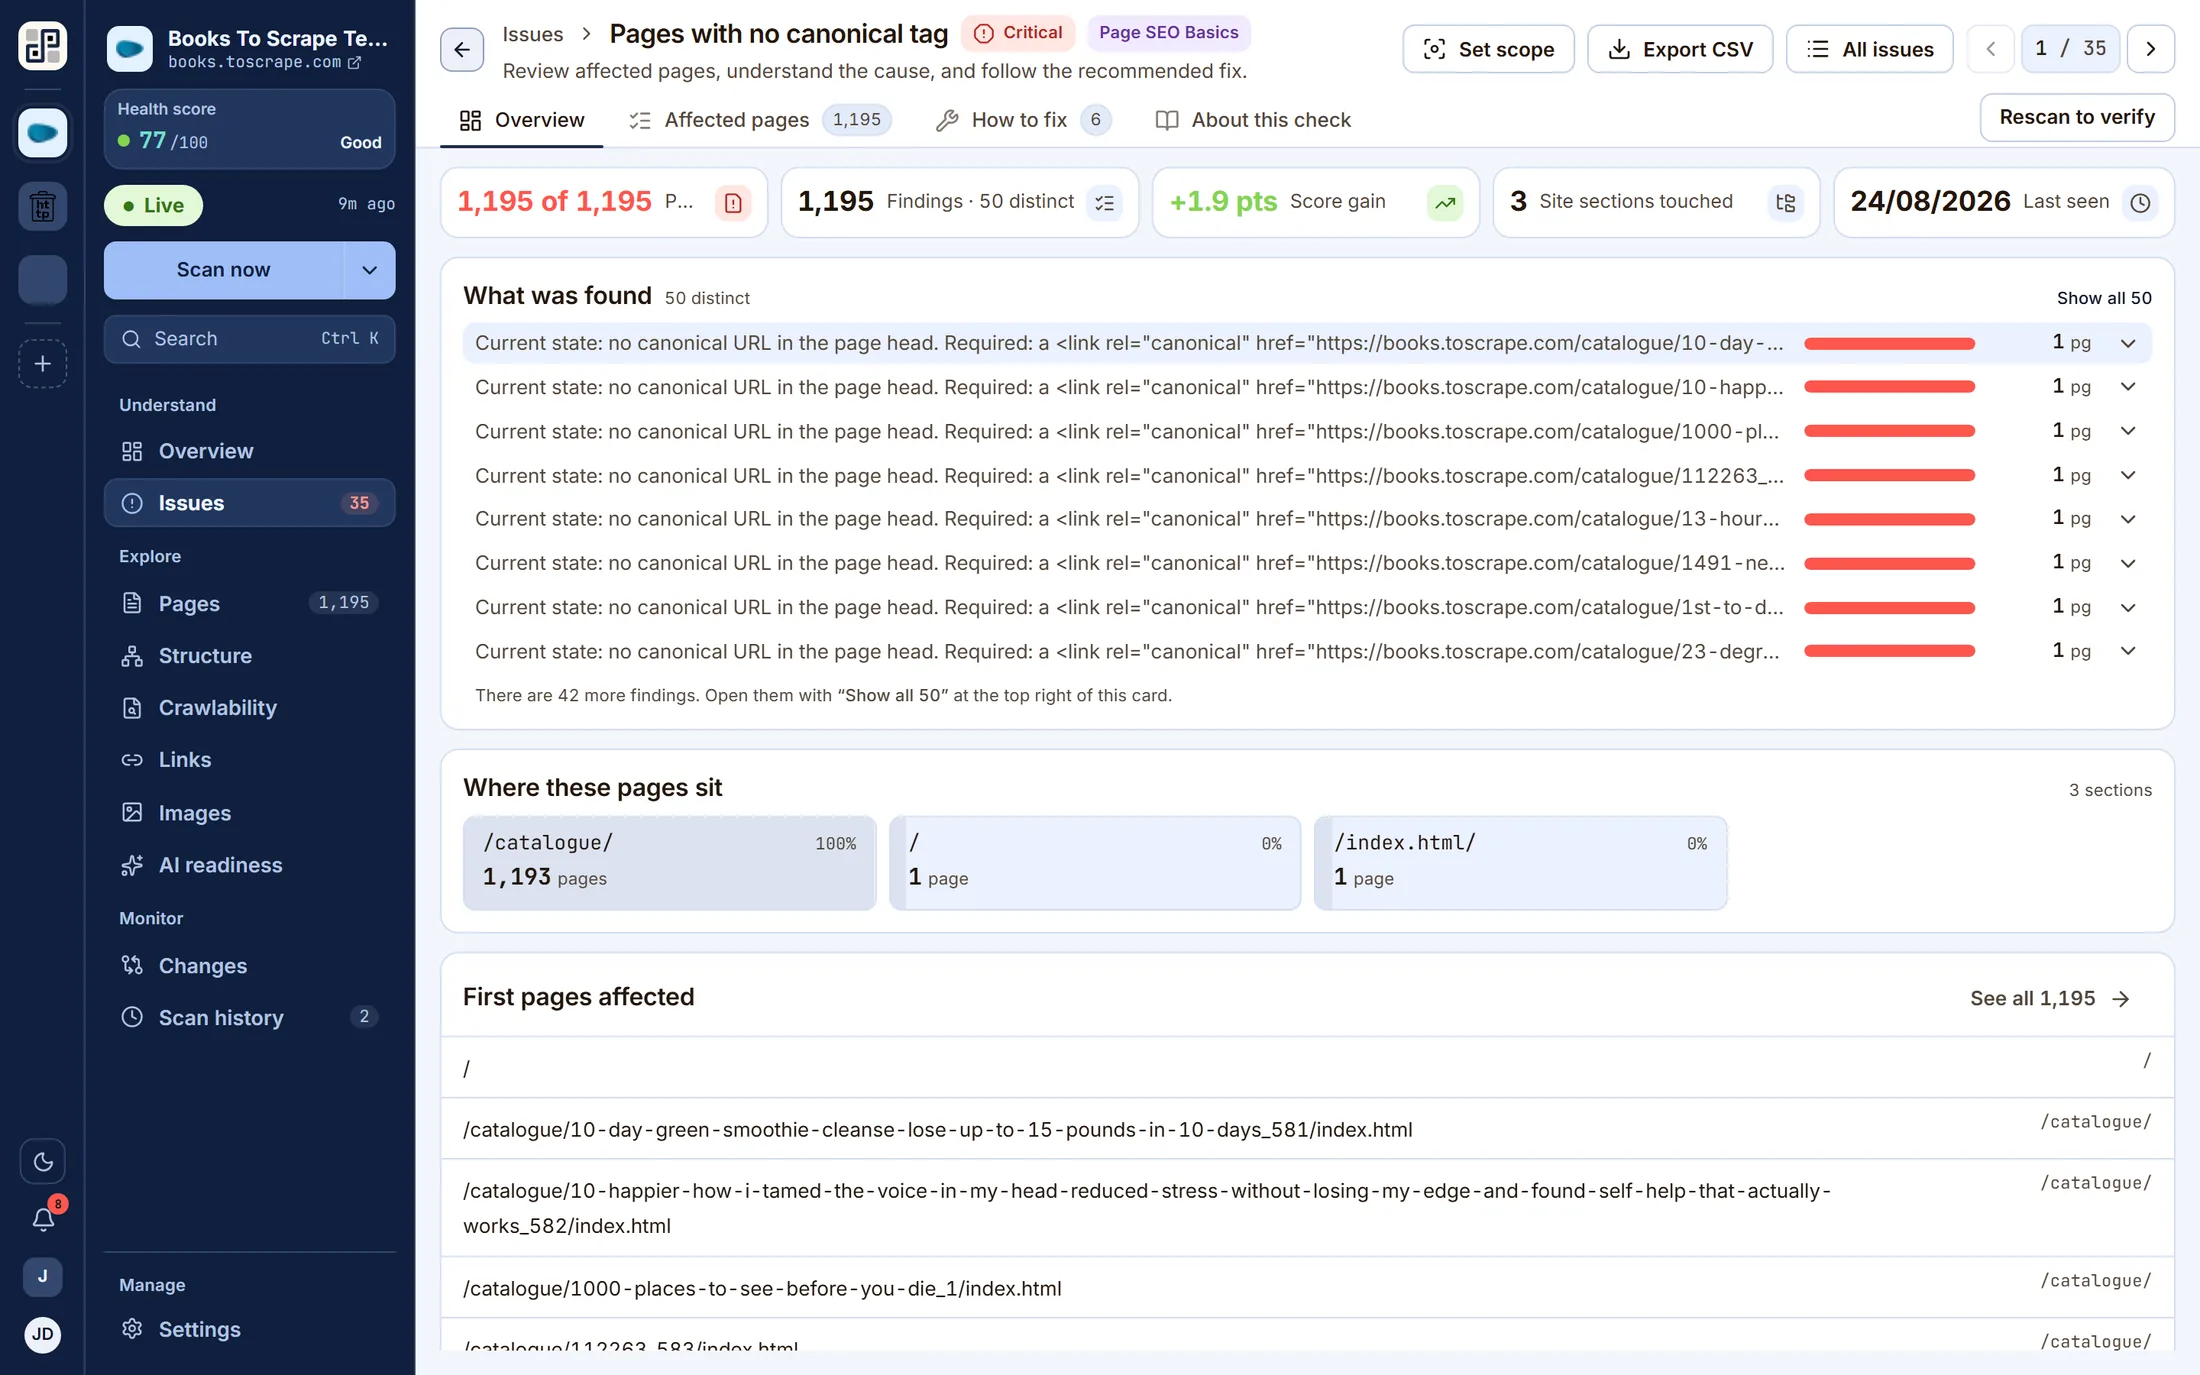
Which pages, and how to fix it
Open a finding and you get every URL it was found on, what was found on each, and the written guide for that check — what it is, why it matters, how to put it right, with examples. All 100+ checks have one.
Pages
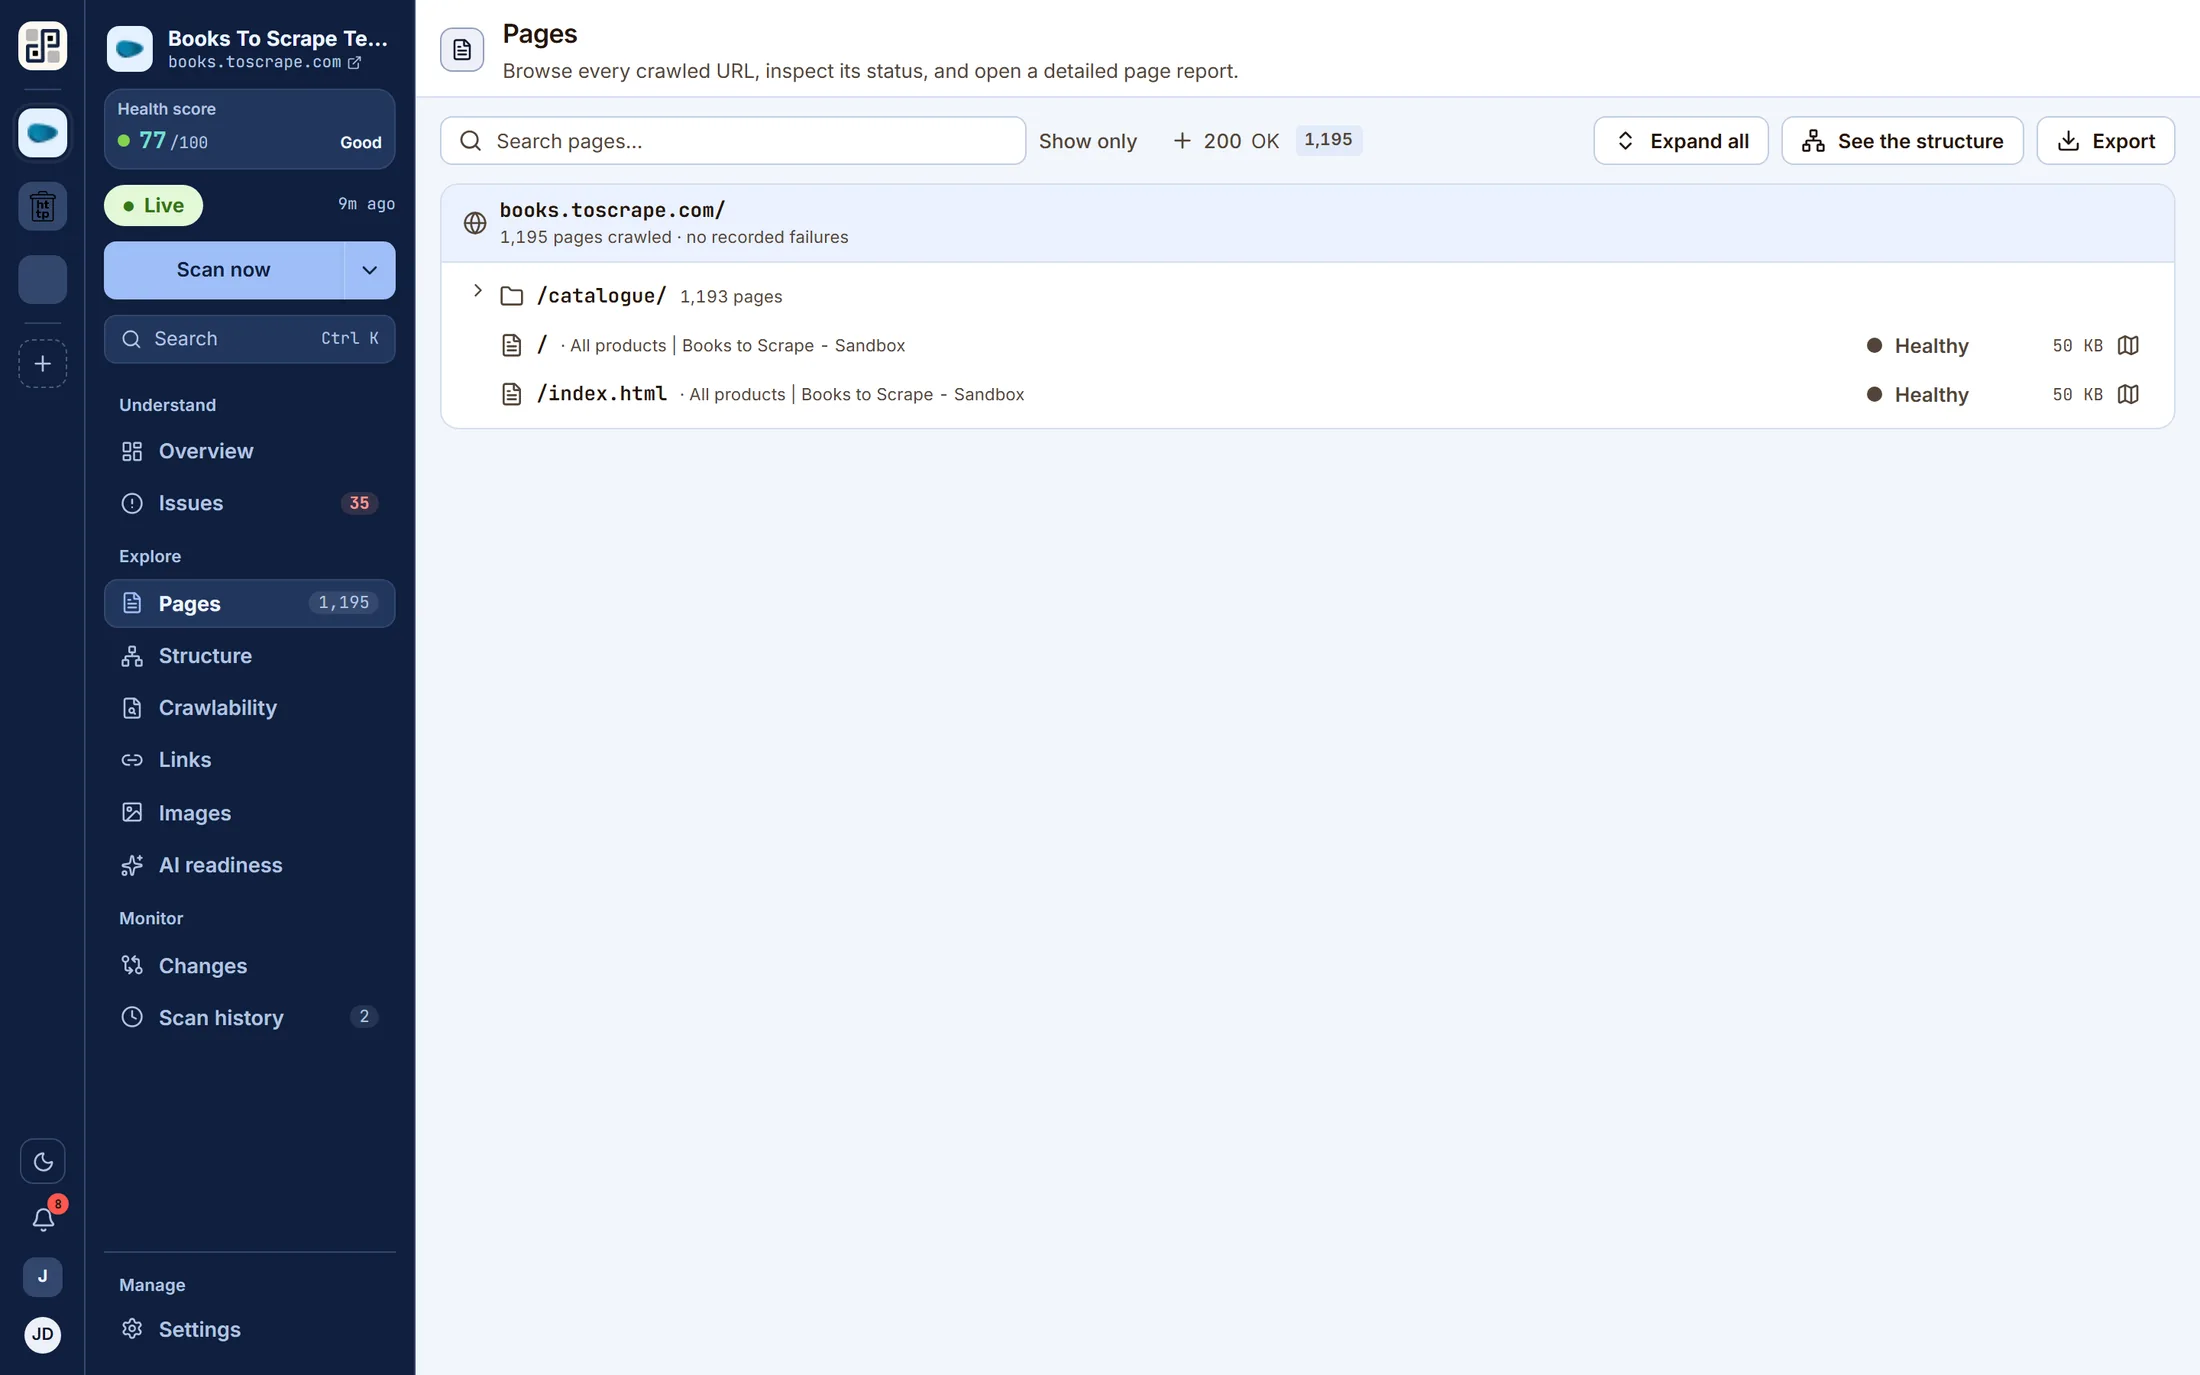
Every URL the crawl found
The full inventory, with status code, findings count and depth from the homepage. Search it, filter by status, and open any row for that page's complete report.
Page report
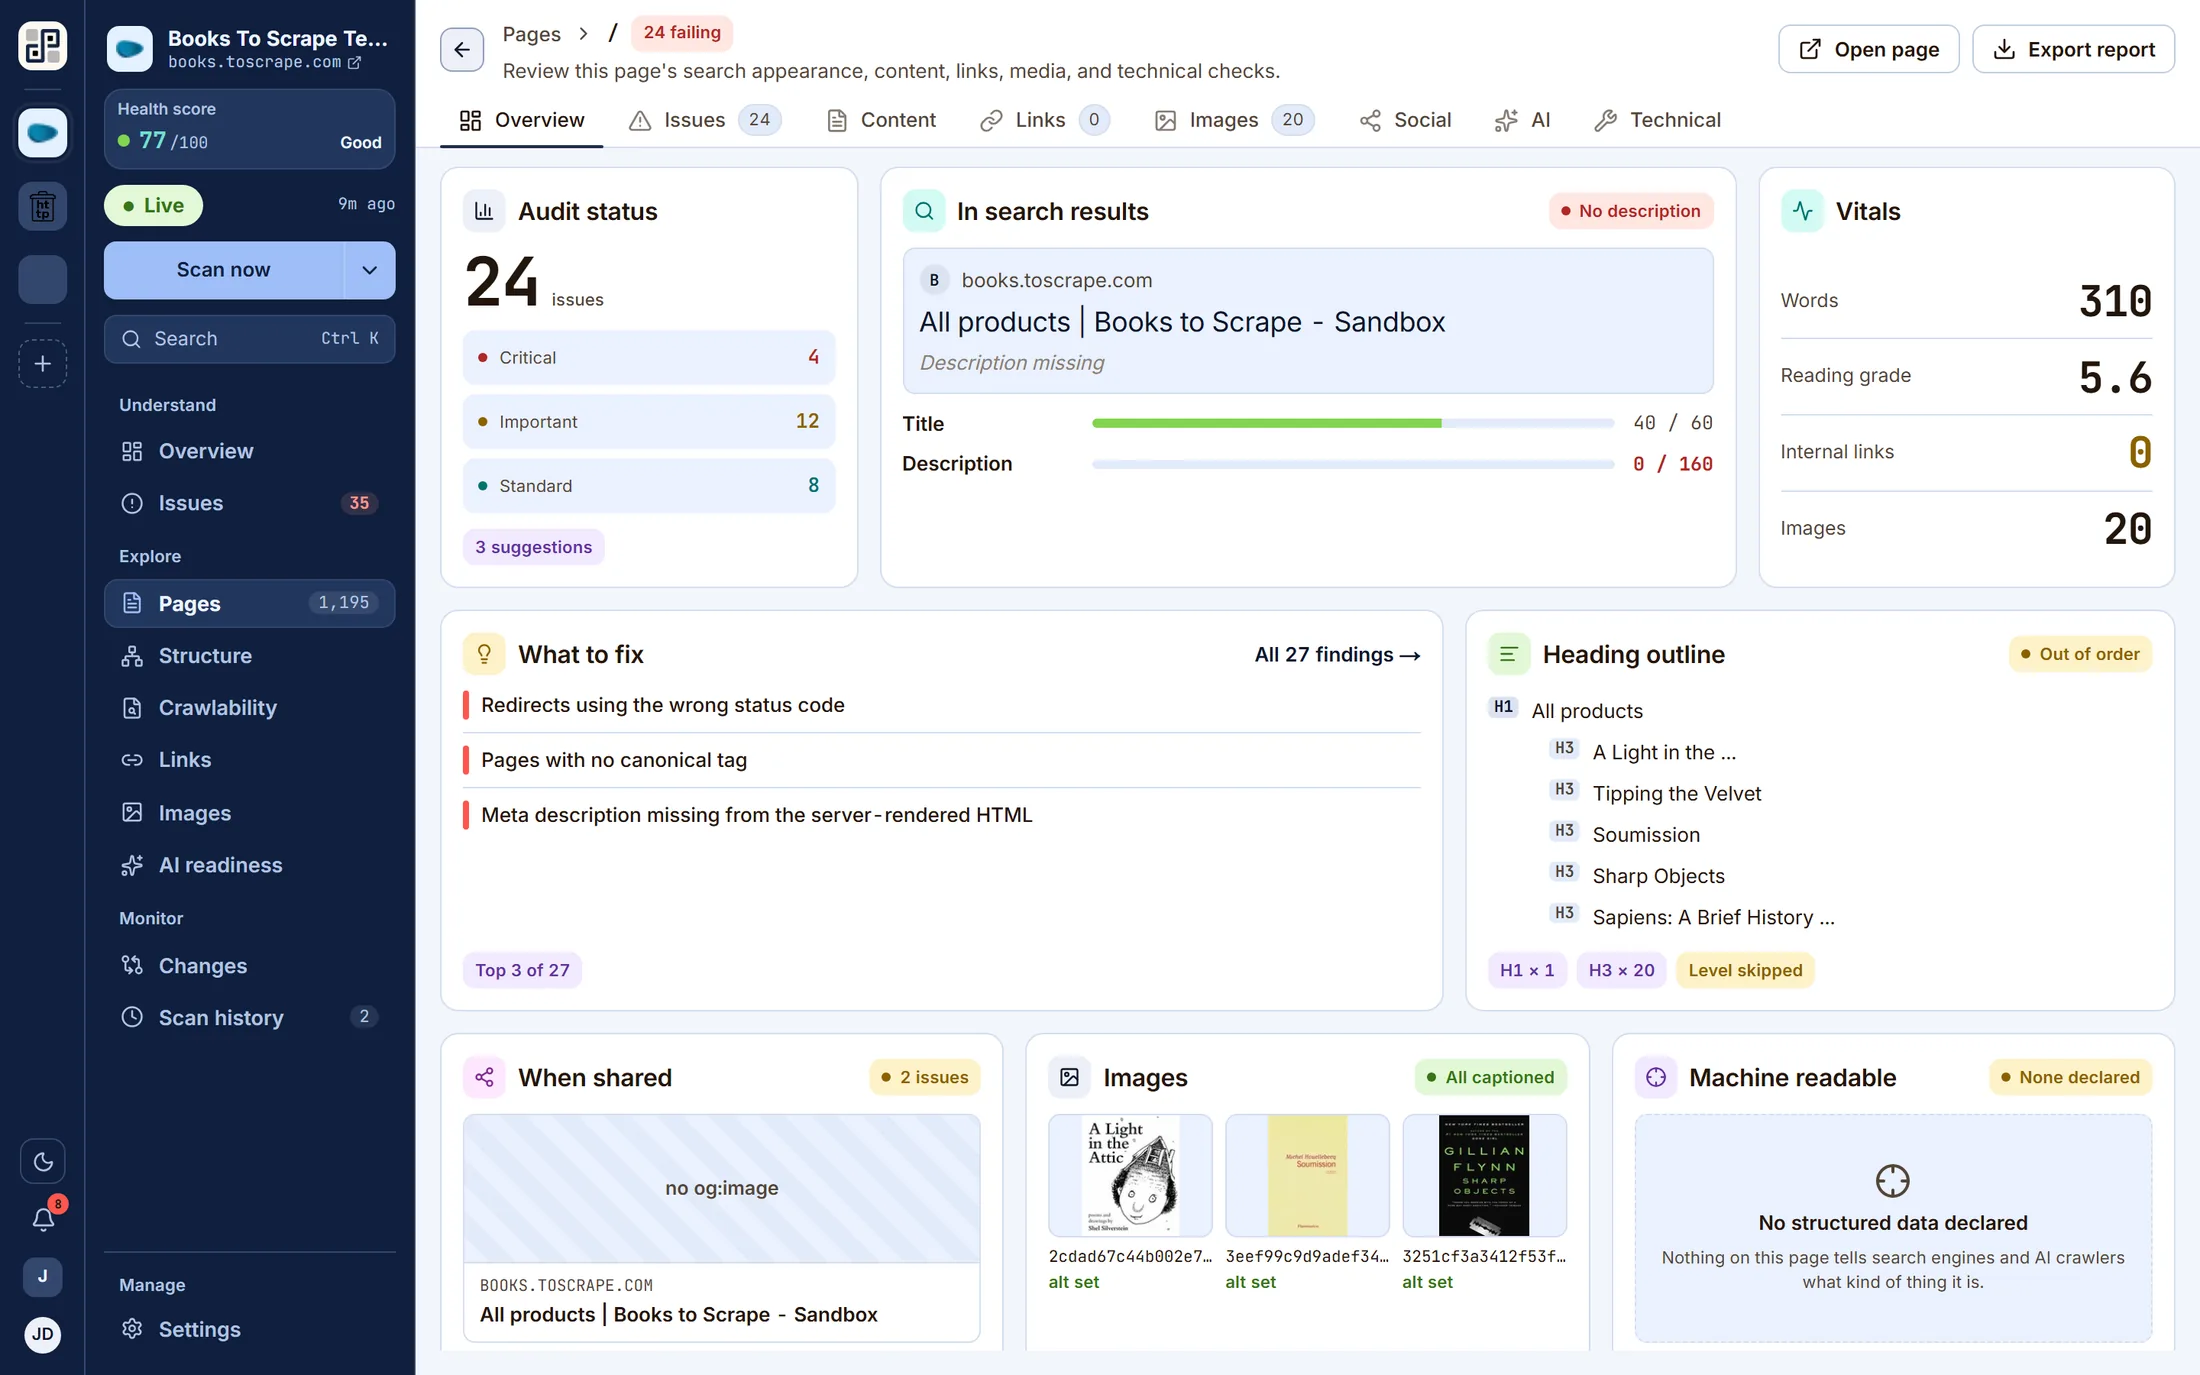
One URL, everything recorded about it
Search appearance with title and description lengths, the heading outline, readability grade, word count, internal and external links with anchor text and status codes, images, JSON-LD, social preview, security headers and the full HTML head — across seven tabs.
- A live search-result preview, so a truncated title is visible rather than described.
- “When shared” renders the Open Graph card the way a social platform would.
- The Technical tab holds headers, canonicals, hreflang and robots directives.
Structure
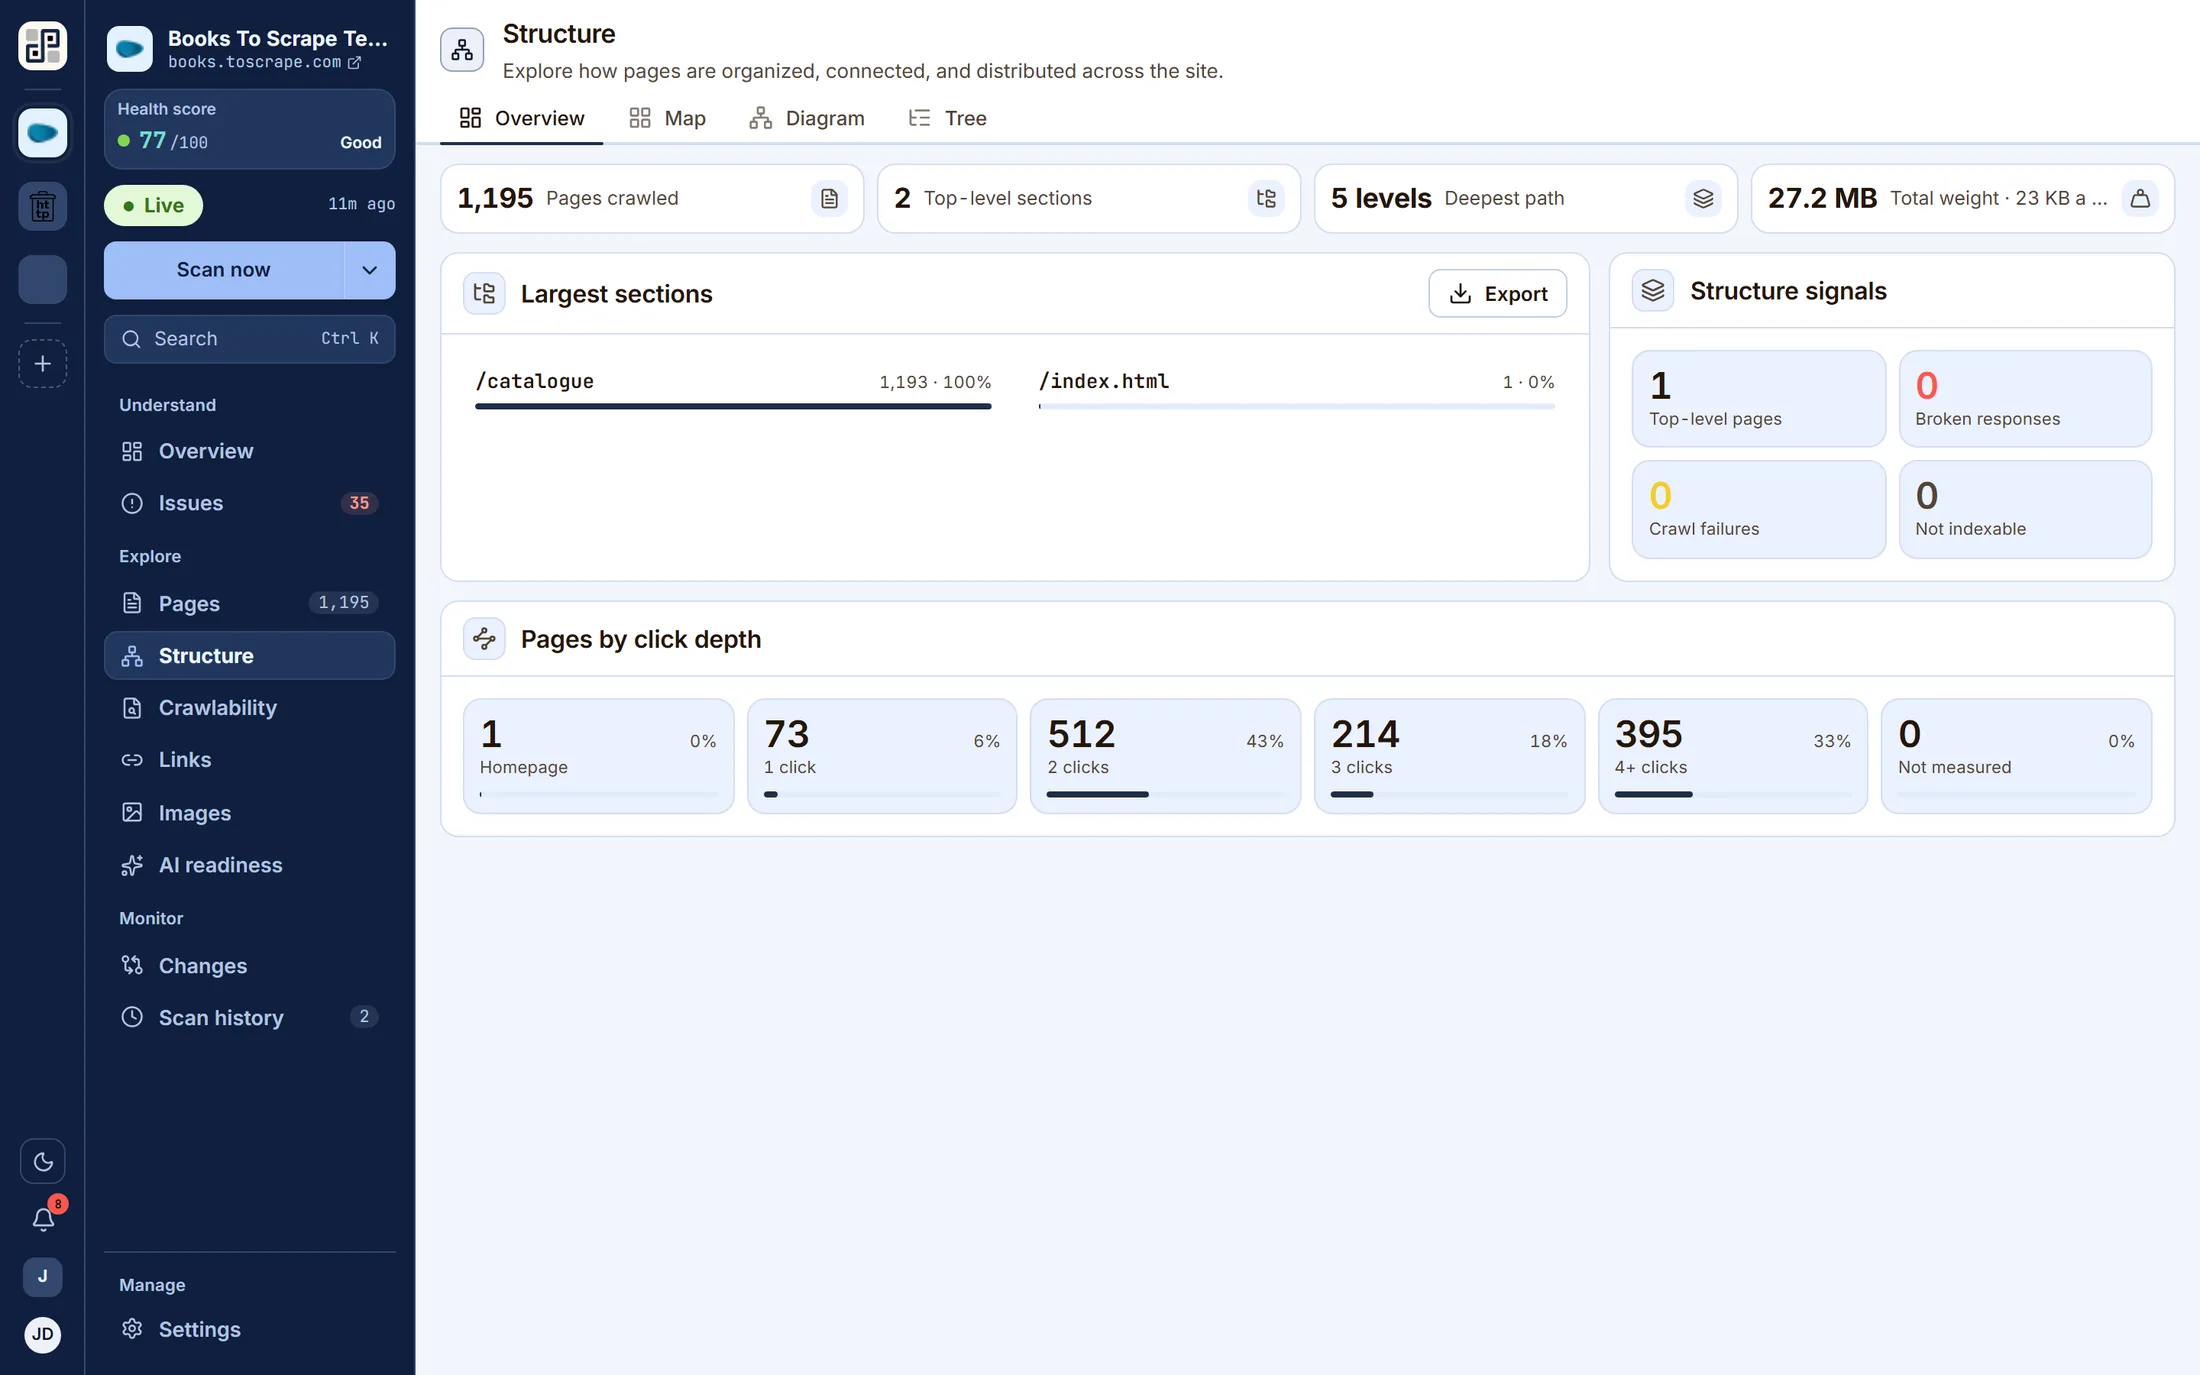
How the site is actually shaped
How many pages, in how many sections, how deep and how heavy — then a treemap, a hierarchy diagram, a tree, a link list and a link map behind the tabs. The shape of a site is the fastest way to spot a section nobody meant to publish.
- Largest sections, deepest path, total weight and average page size — “3.1 MB · 27 KB a page”.
- Click depth distribution: 61% of this site is one click from the homepage, 38% is two, and nothing is deeper.
- Structure signals — top-level pages, broken responses, crawl failures, not-indexable.
Changes
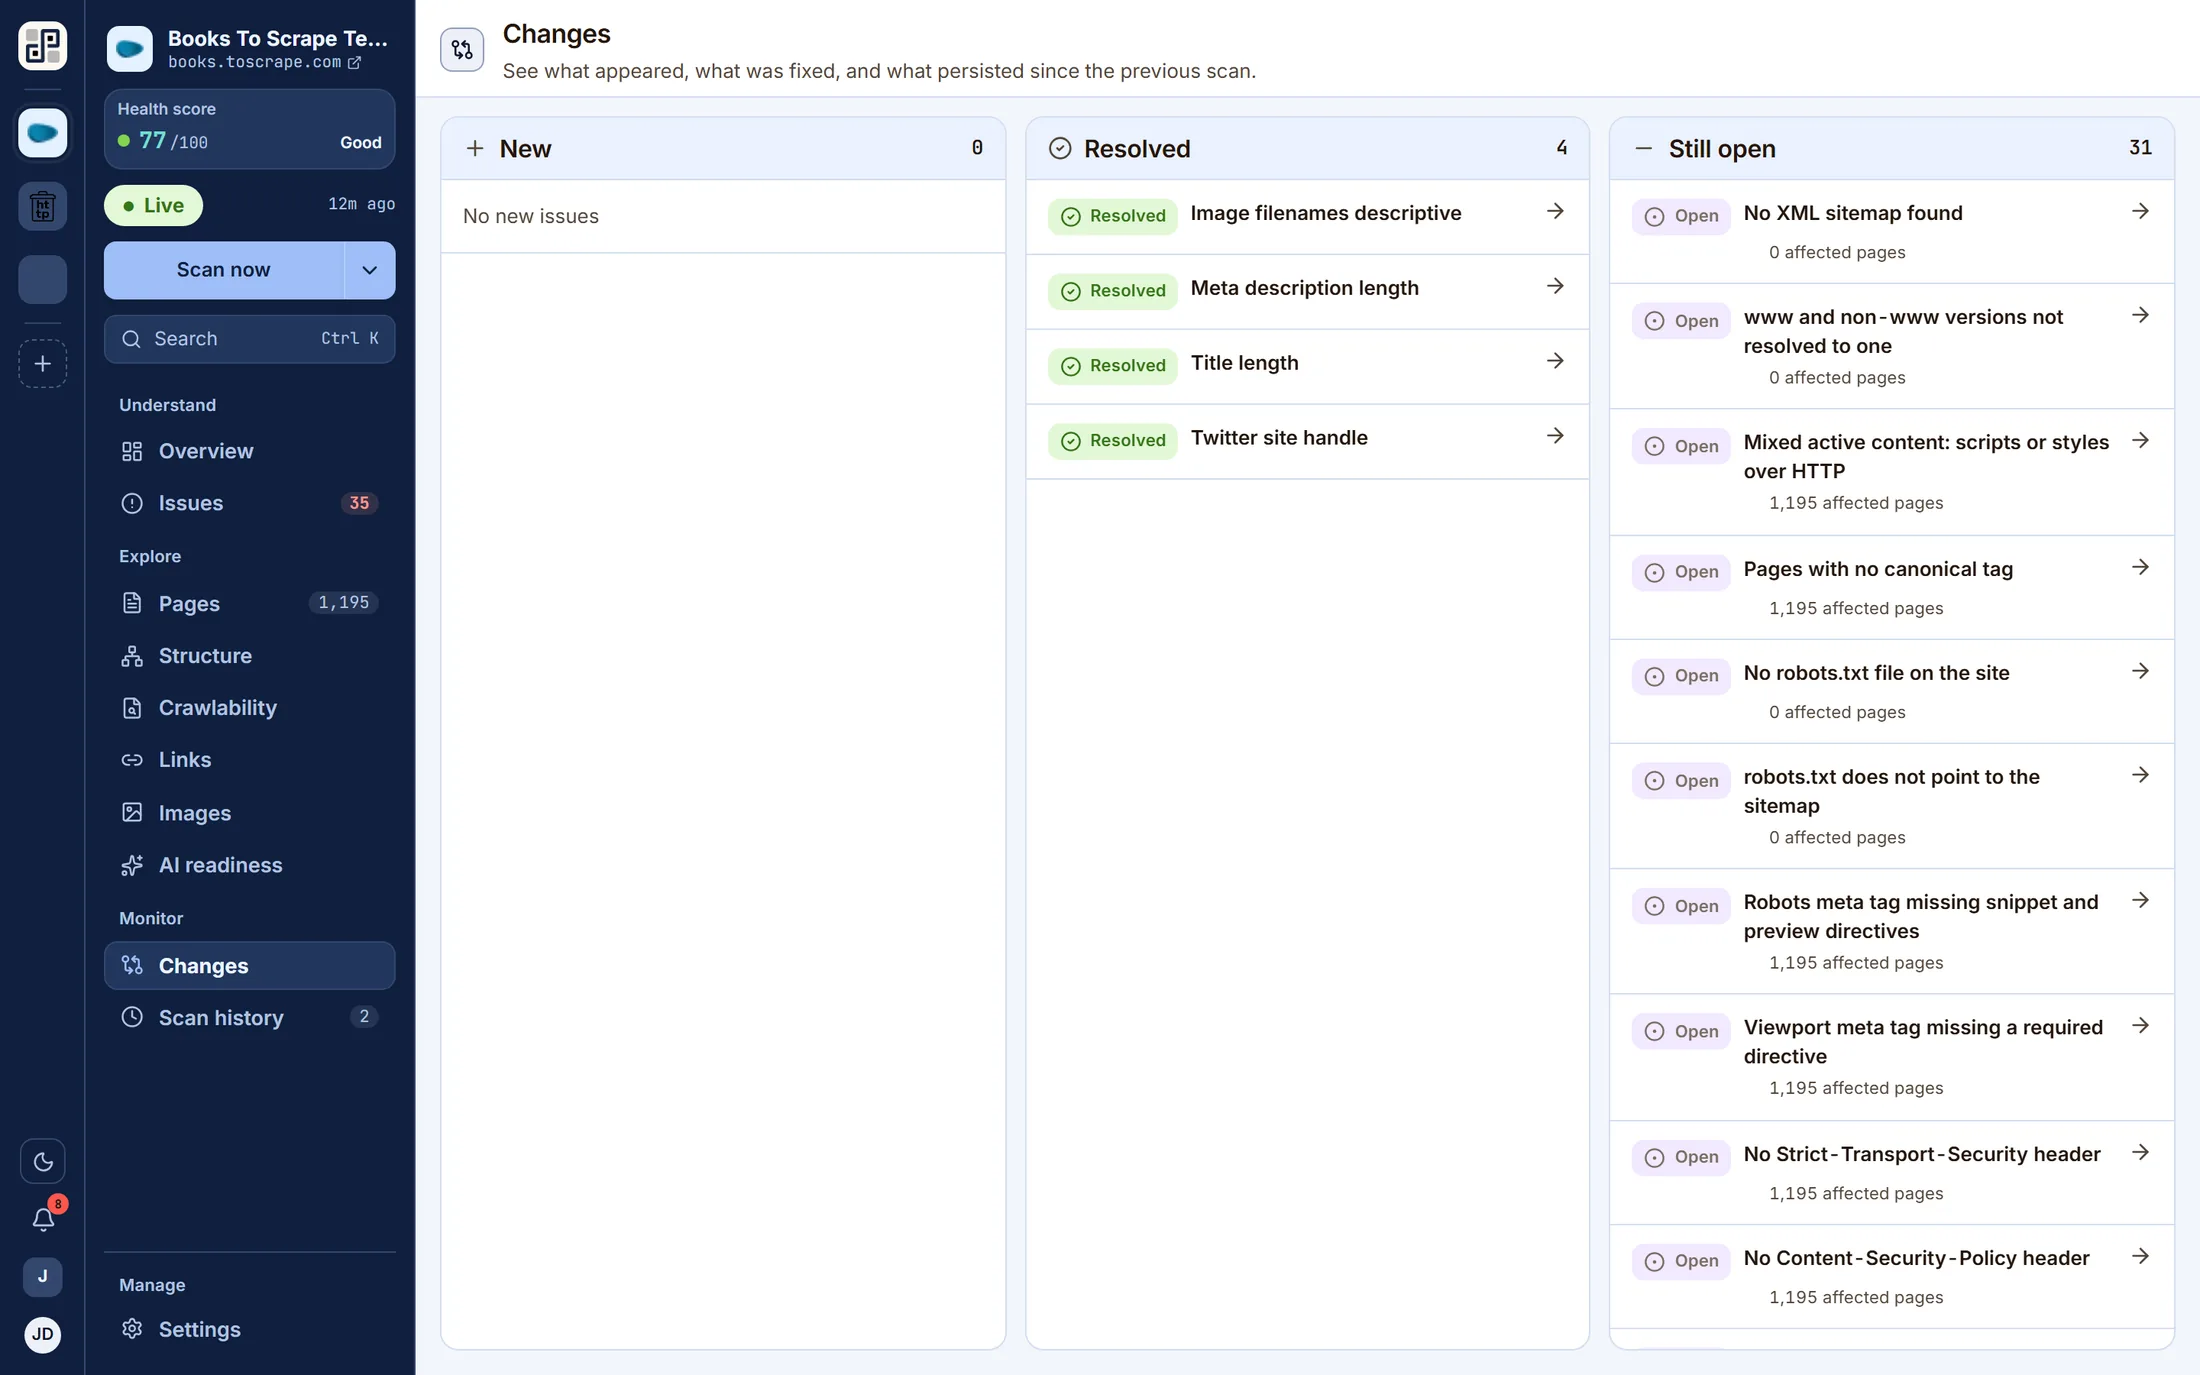
What is different since the last scan
Three columns — new, resolved, still open — comparing this run with the previous one on the same branch. This is the screen the product exists for; everything else describes a site, and this one describes a change.
- Comparison is per branch, so a preview crawl never becomes production's baseline.
- Resolved findings stay listed, so a fix is visible rather than silently absent.
- Every entry opens the finding it came from.
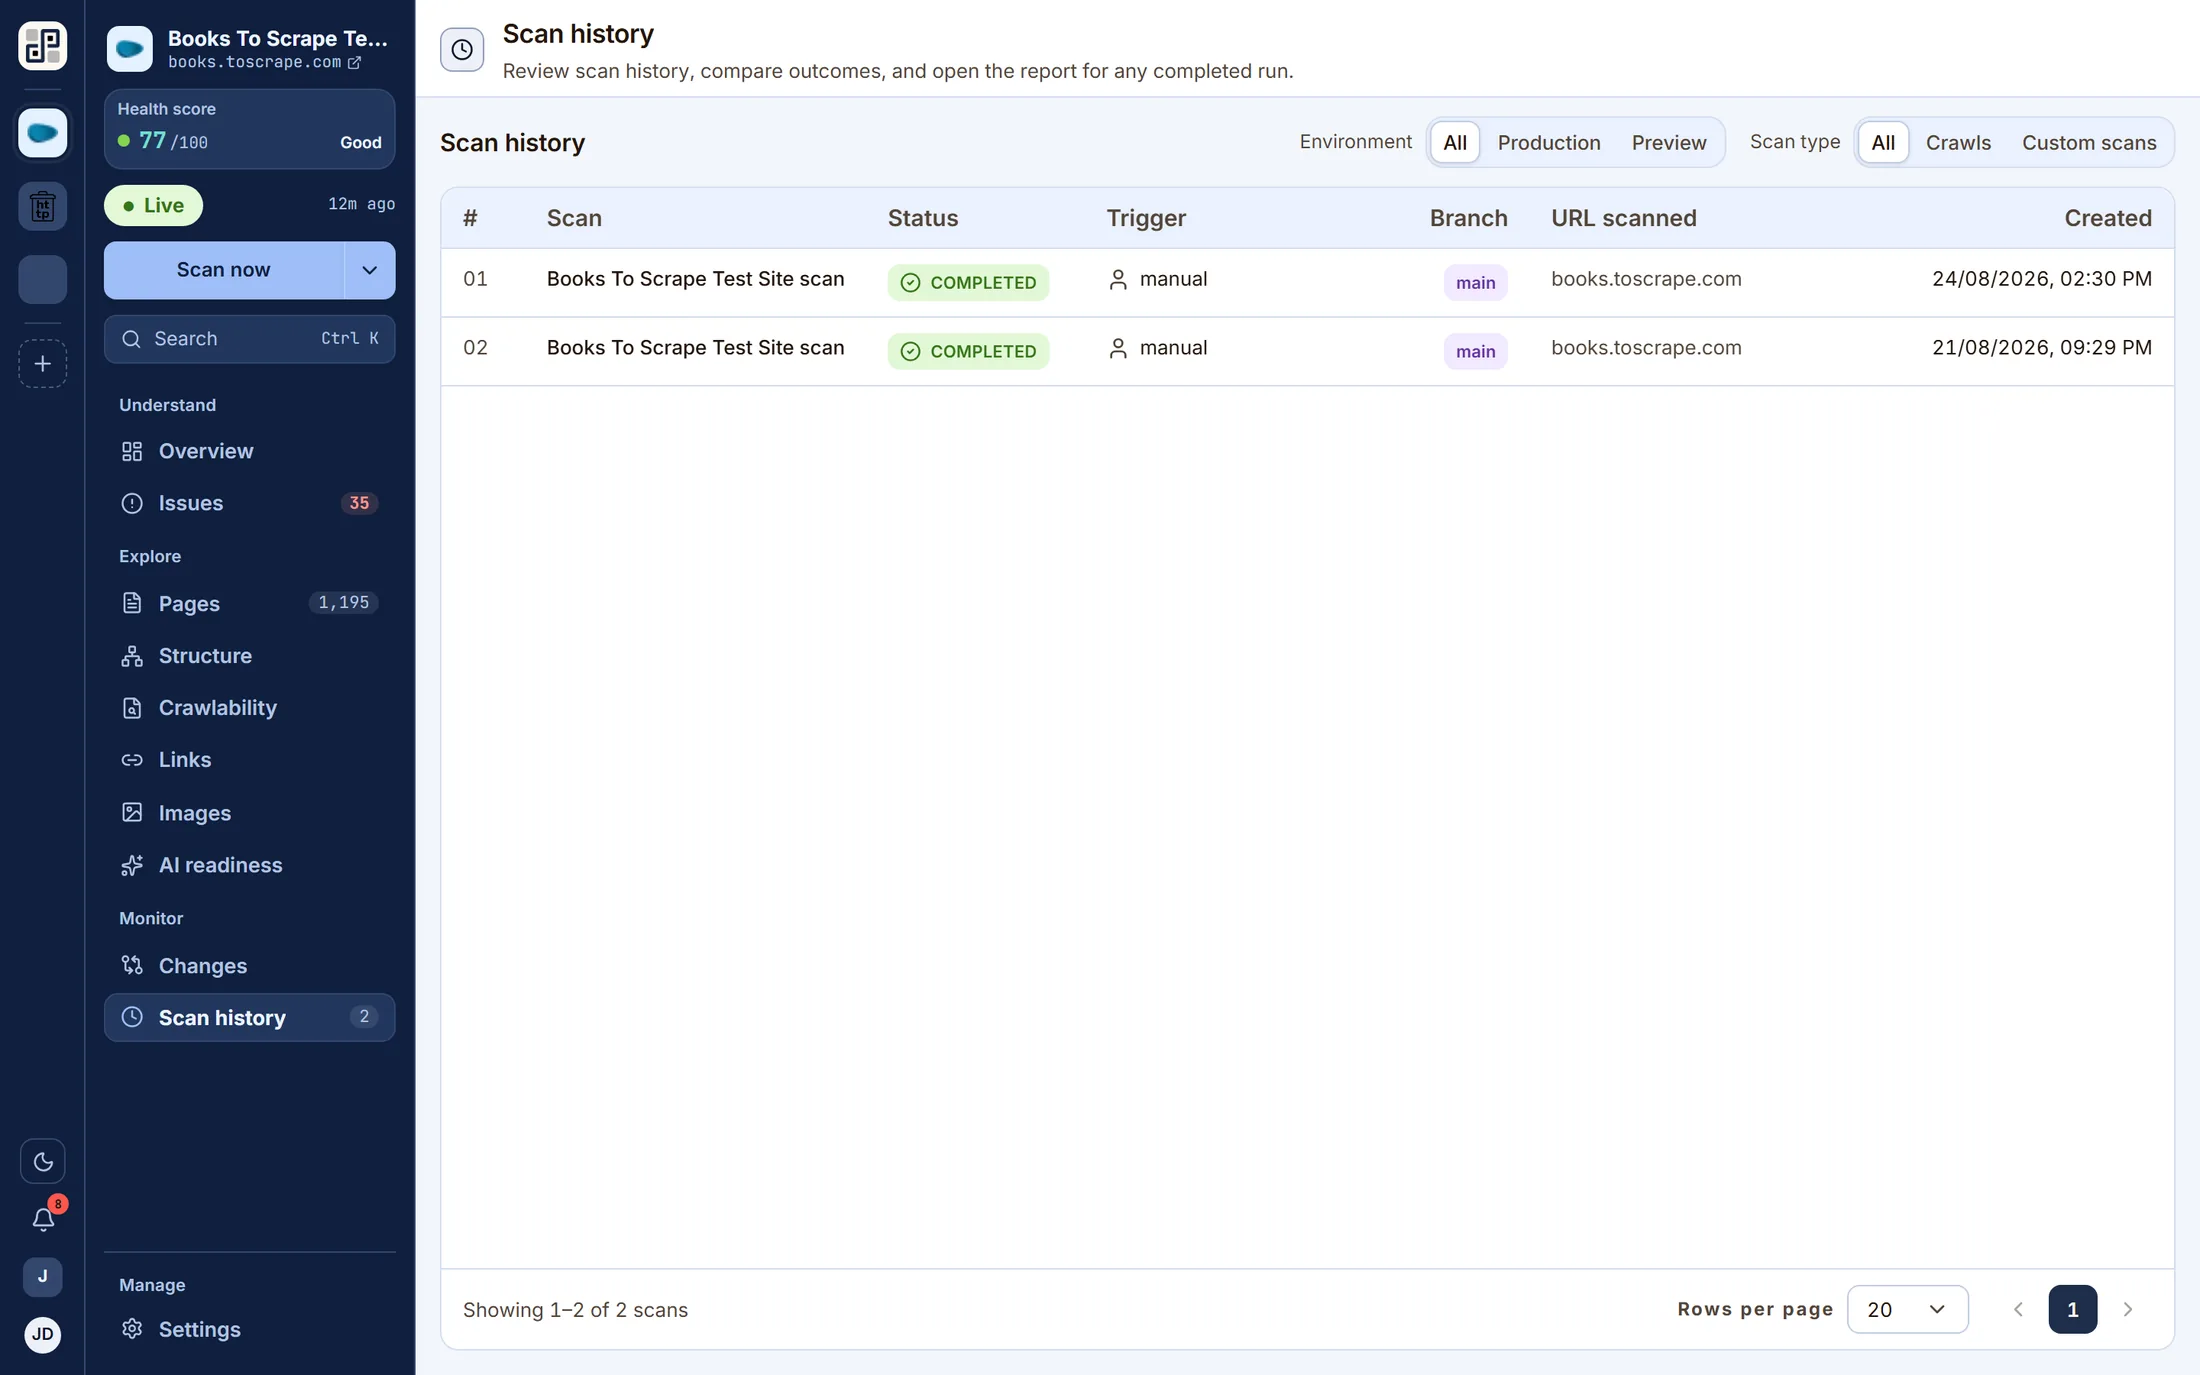
Scan history
Every run, kept
Each scan has its own report: the score it measured, the checks it failed, how long it took and which branch it ran against. You can always go back to the run before the one that broke something and read the site as it was that day.
And the rest
Crawlability, links, images, settings and billing
Four more lenses on the same crawl, plus the two screens that decide how a site is scanned and what it costs.
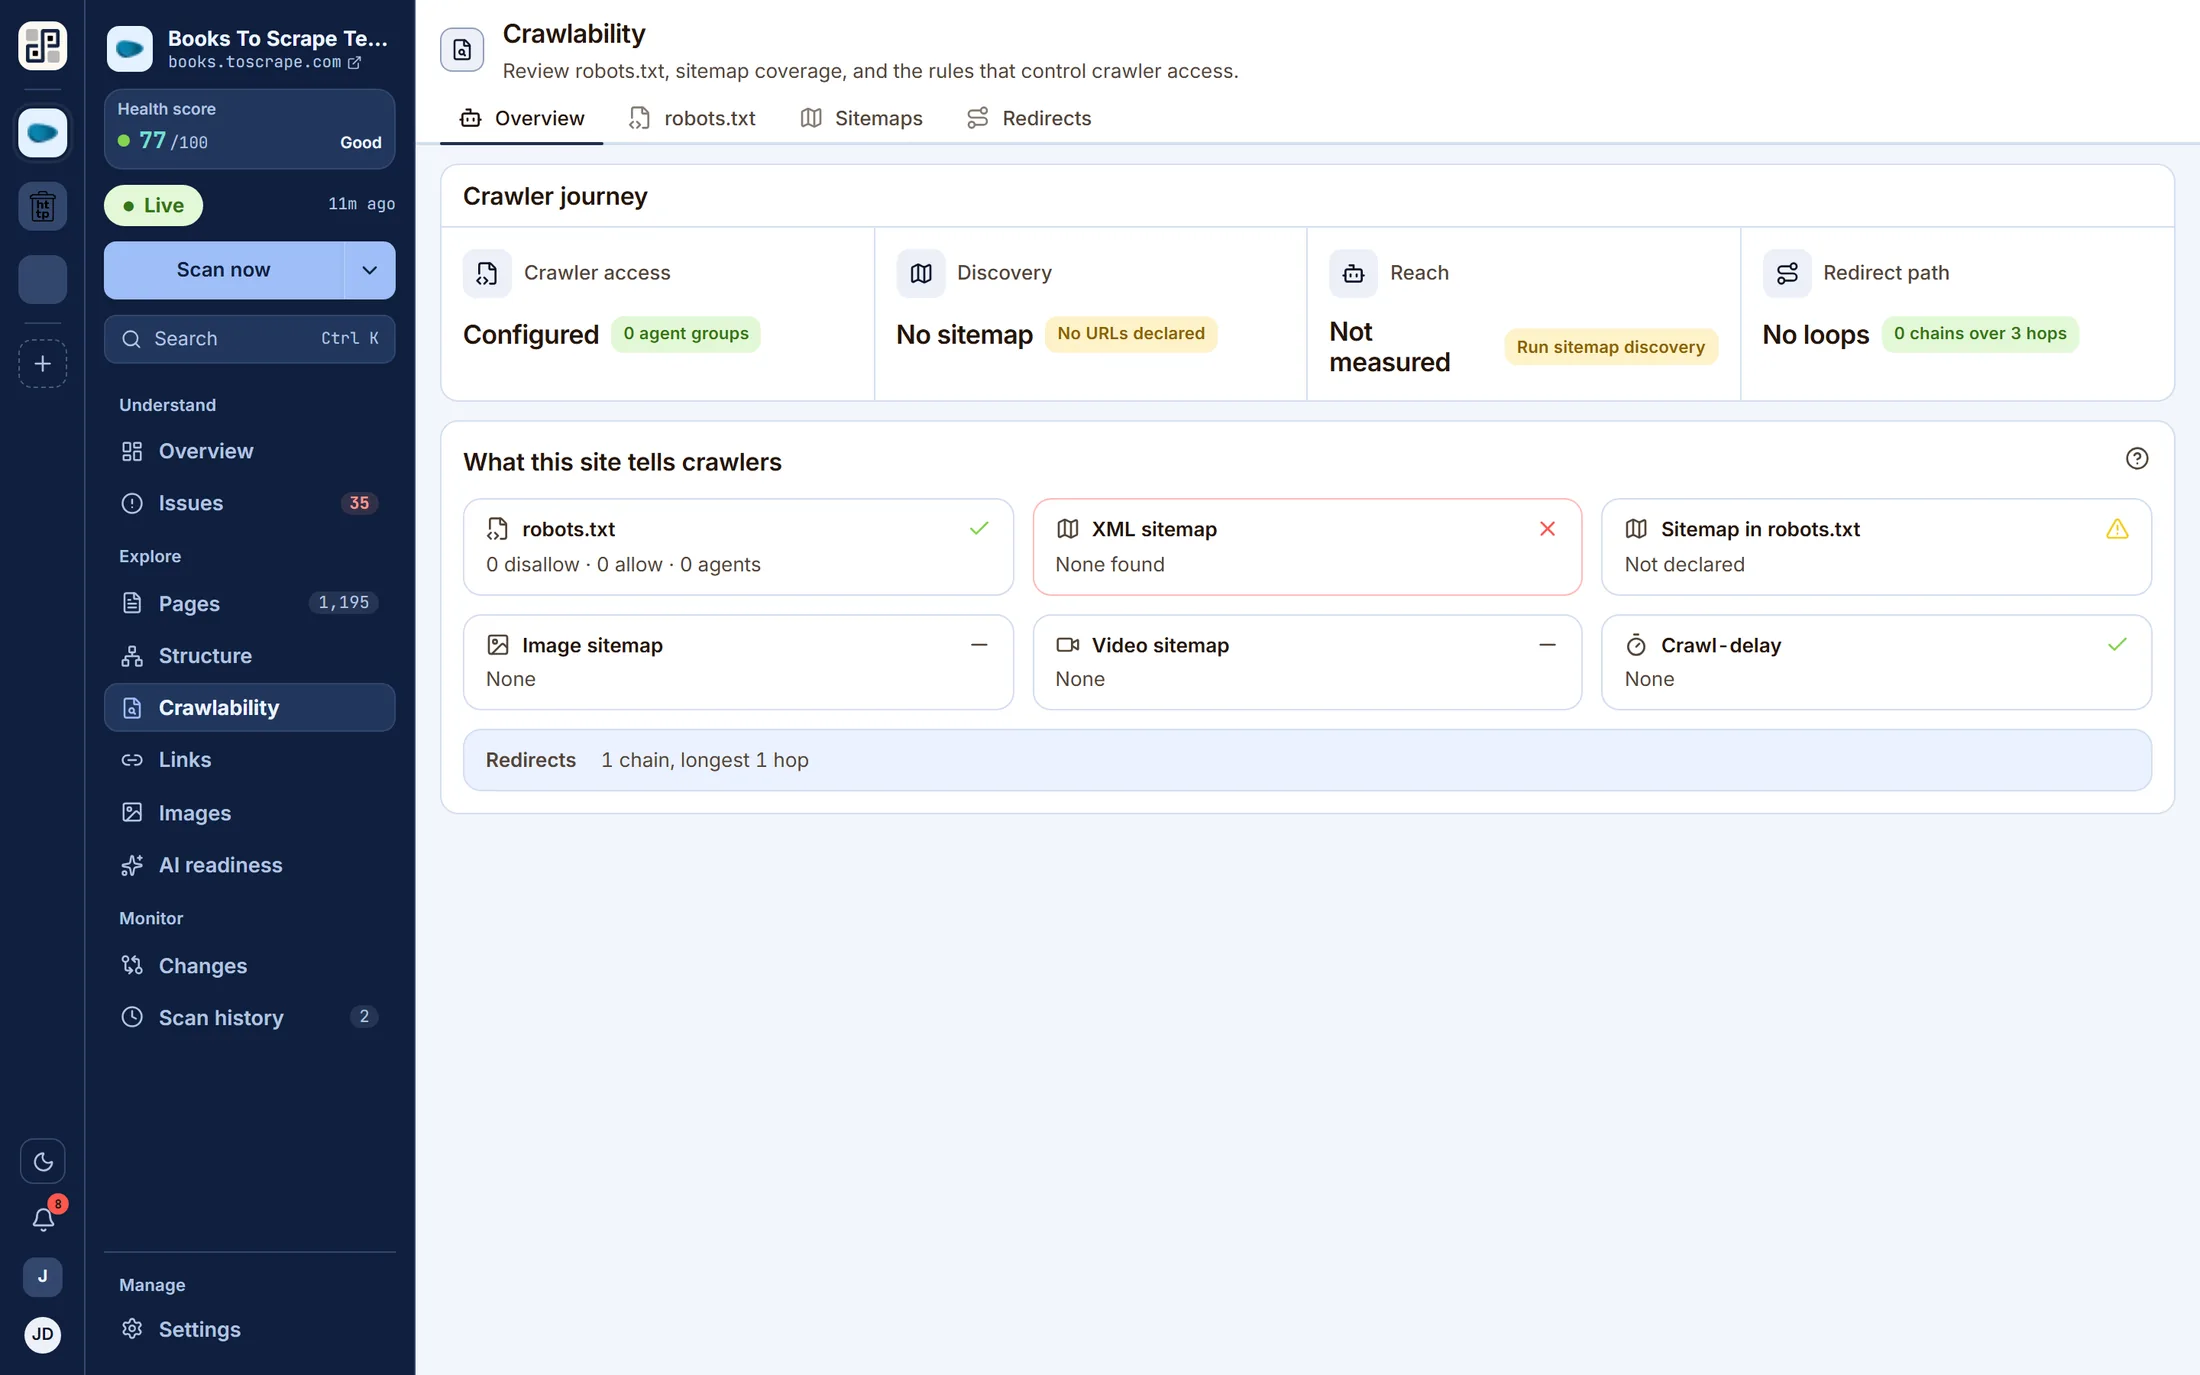
Crawlability
robots.txt and sitemap coverage read against each other, because a sitemap listing URLs robots.txt disallows is invisible if you can only see one at a time.
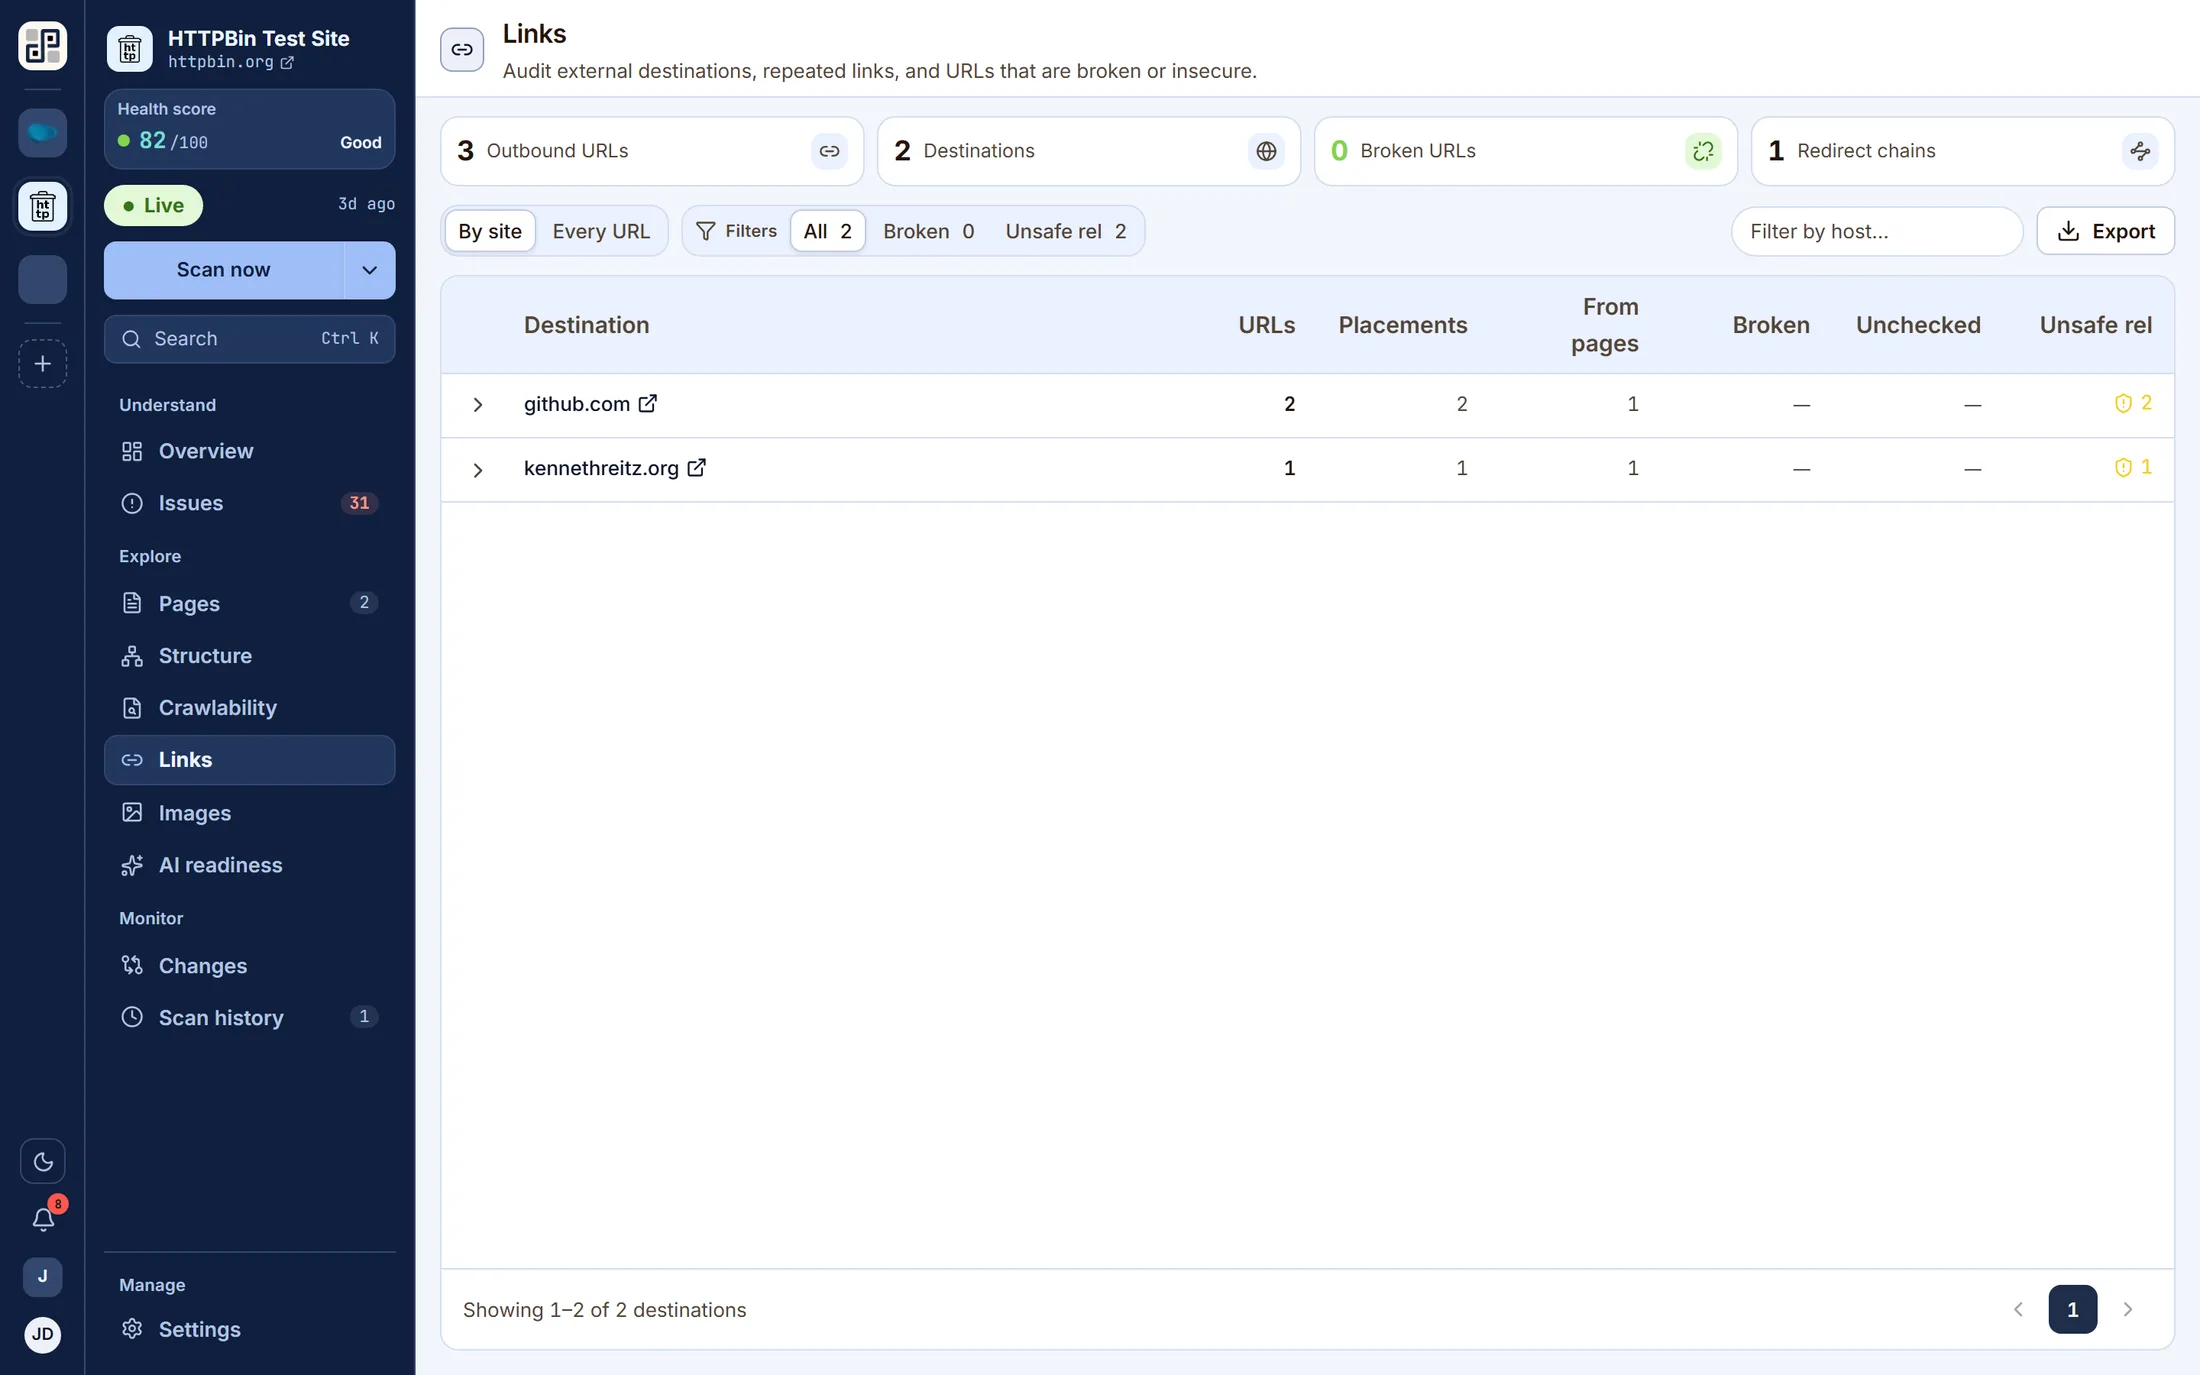
Links
External destinations grouped by the site they point at, repeated links, and every URL that is broken or served over plain HTTP.
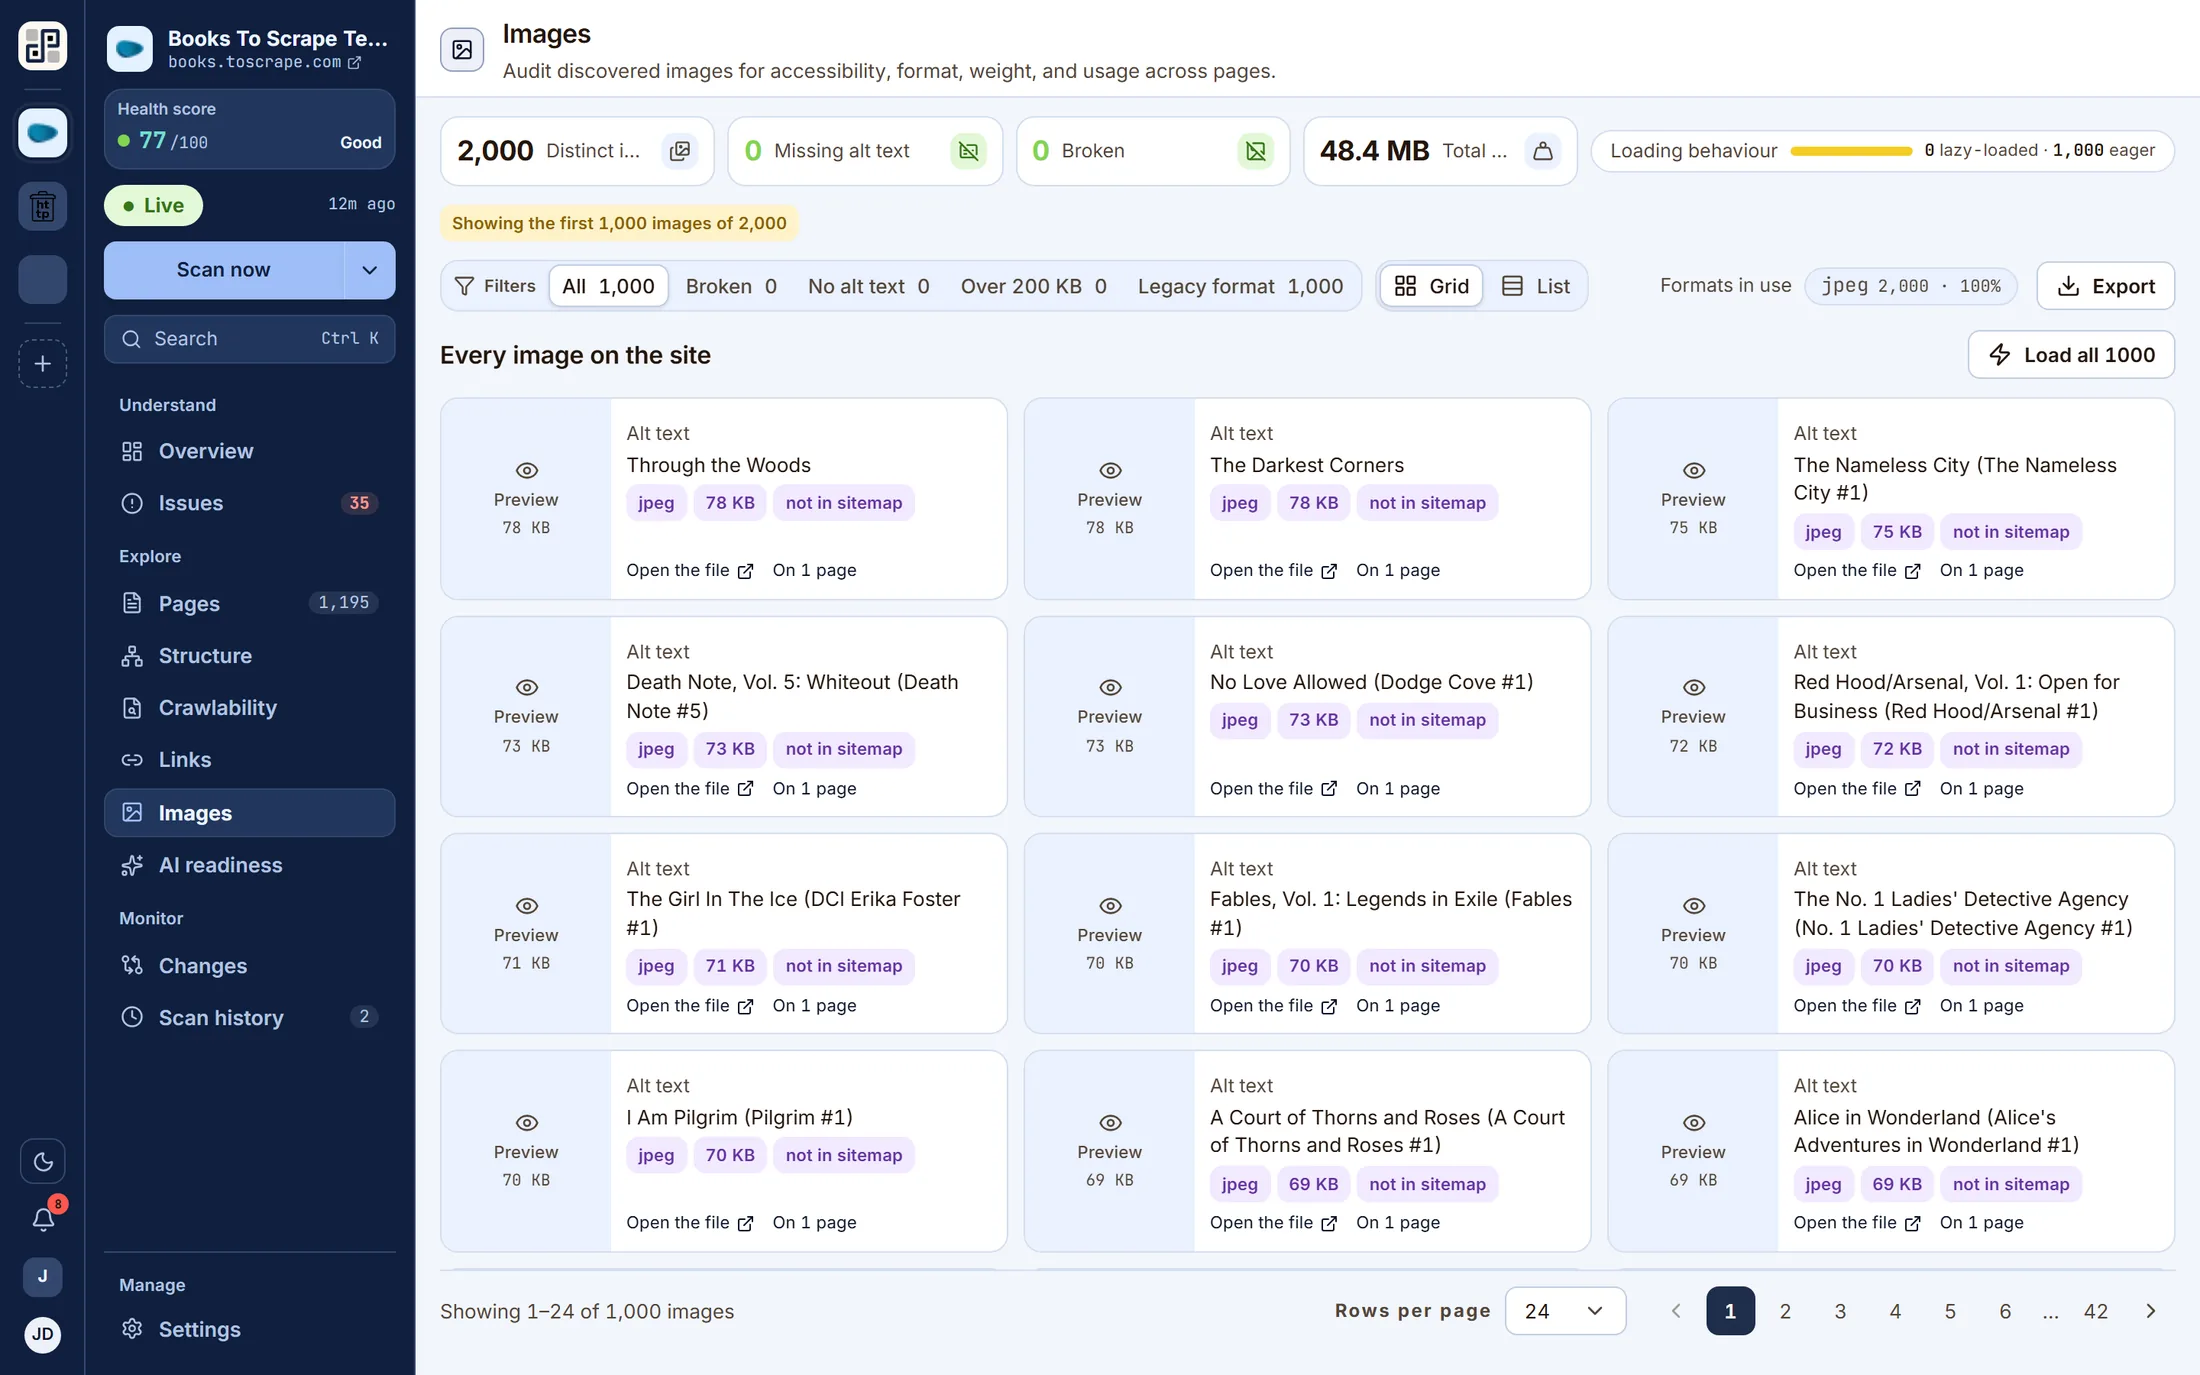
Images
Every discovered image audited for alt text, width and height attributes, format and weight, with the pages each appears on.
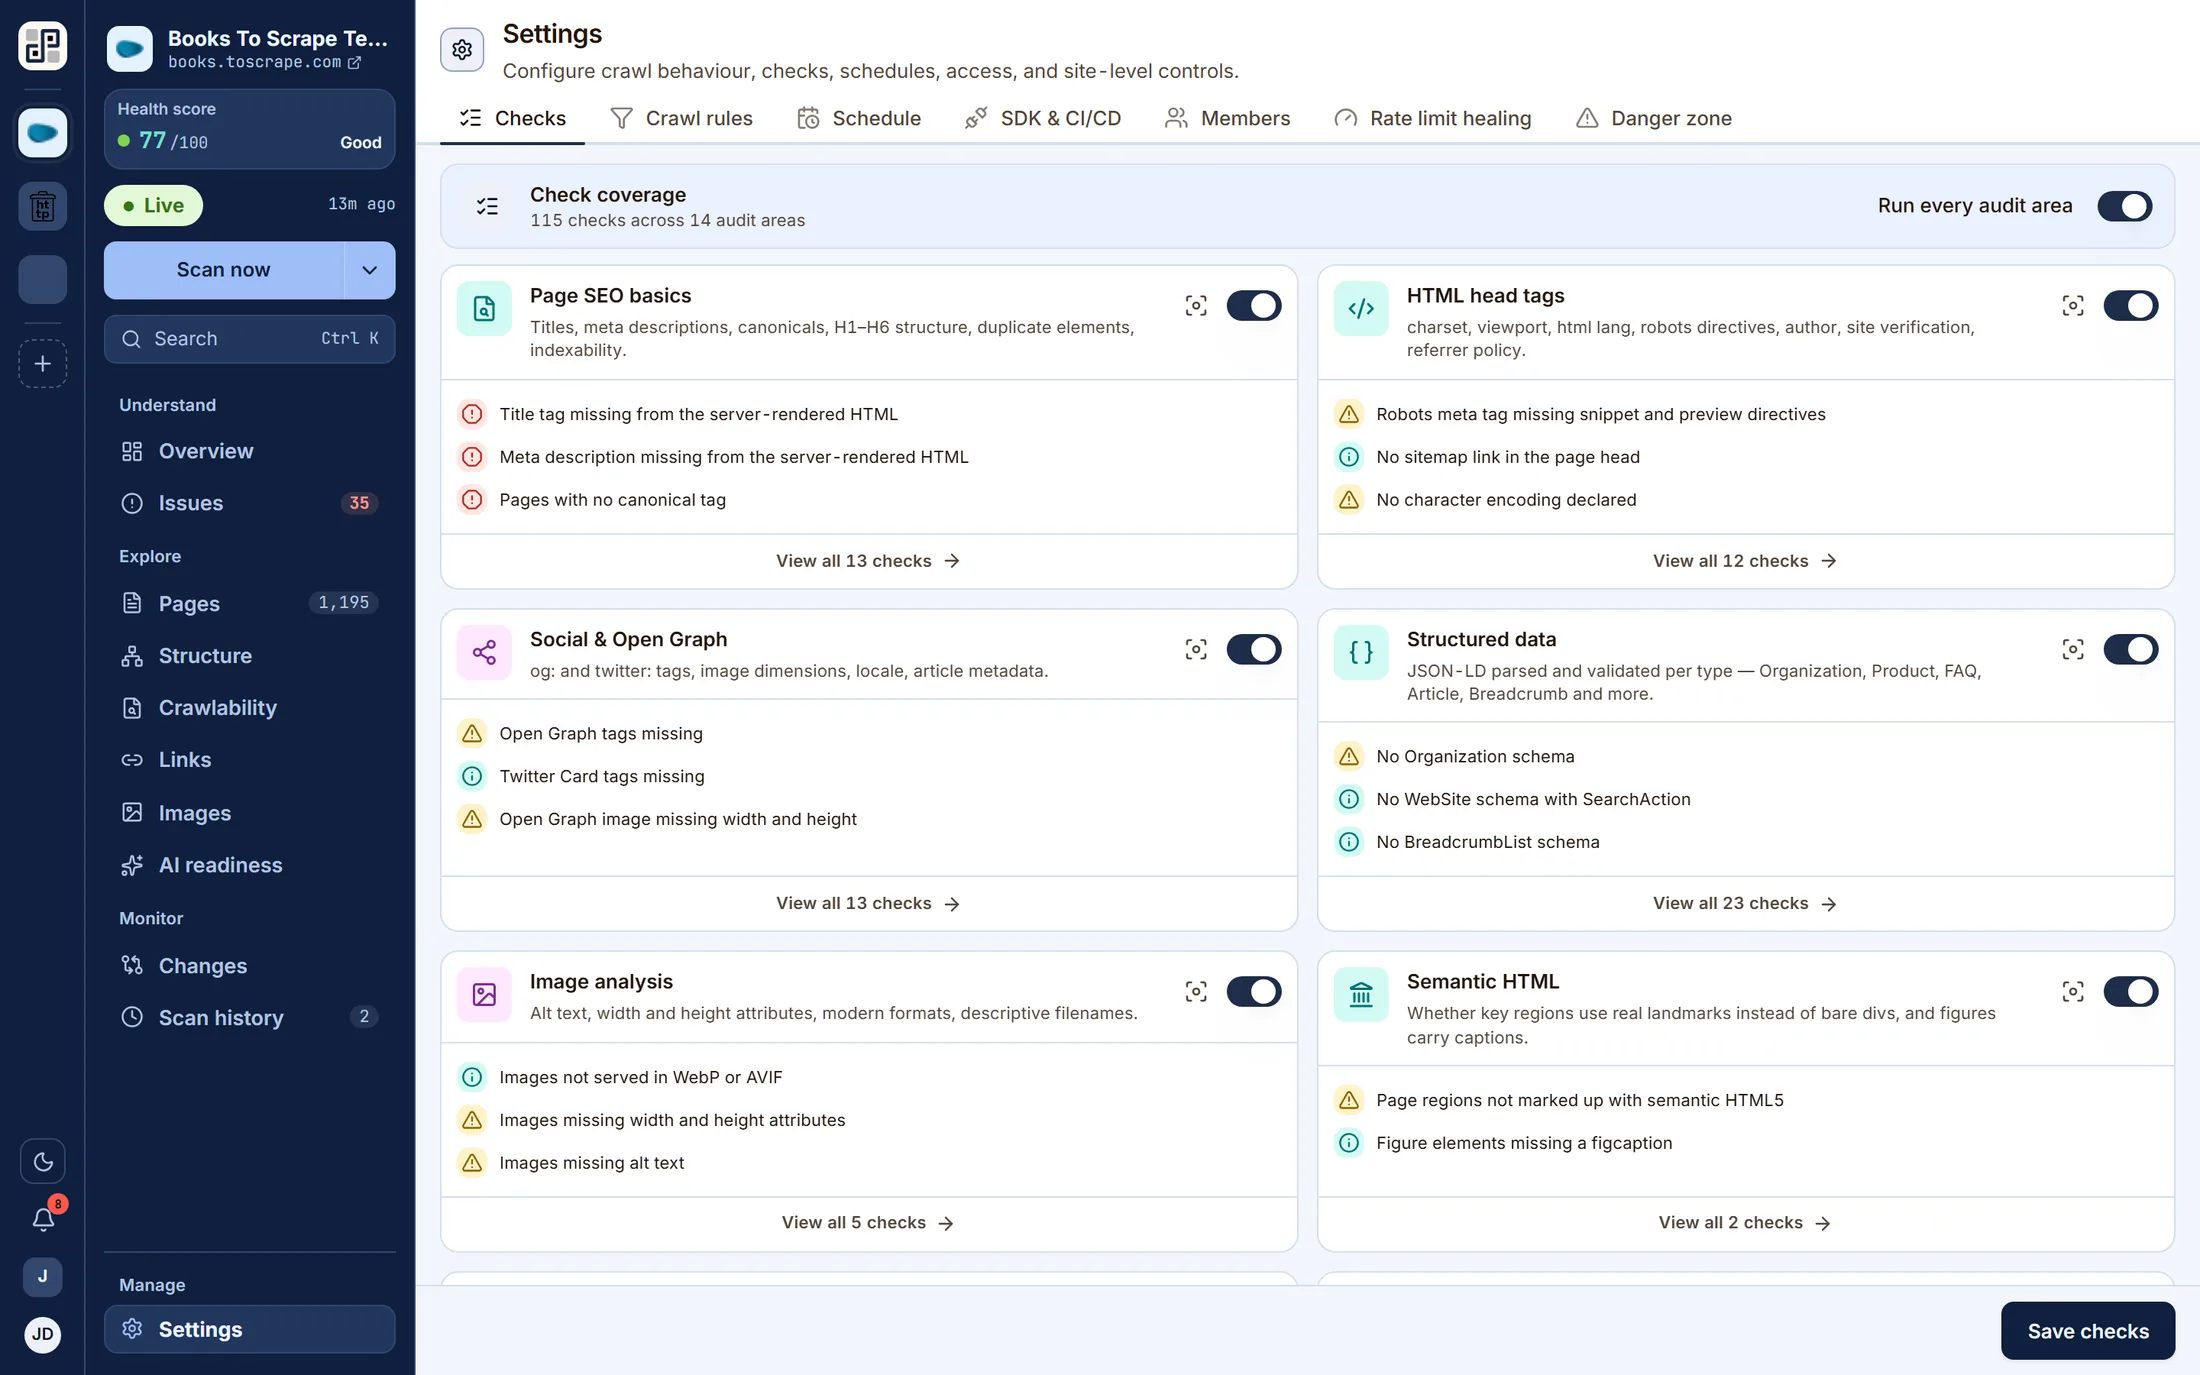
Settings
Turn a discipline off per site, set crawl rules and exclusions, put the site on a daily, weekly or monthly schedule, issue a CI/CD secret, and manage who can see it.
Billing
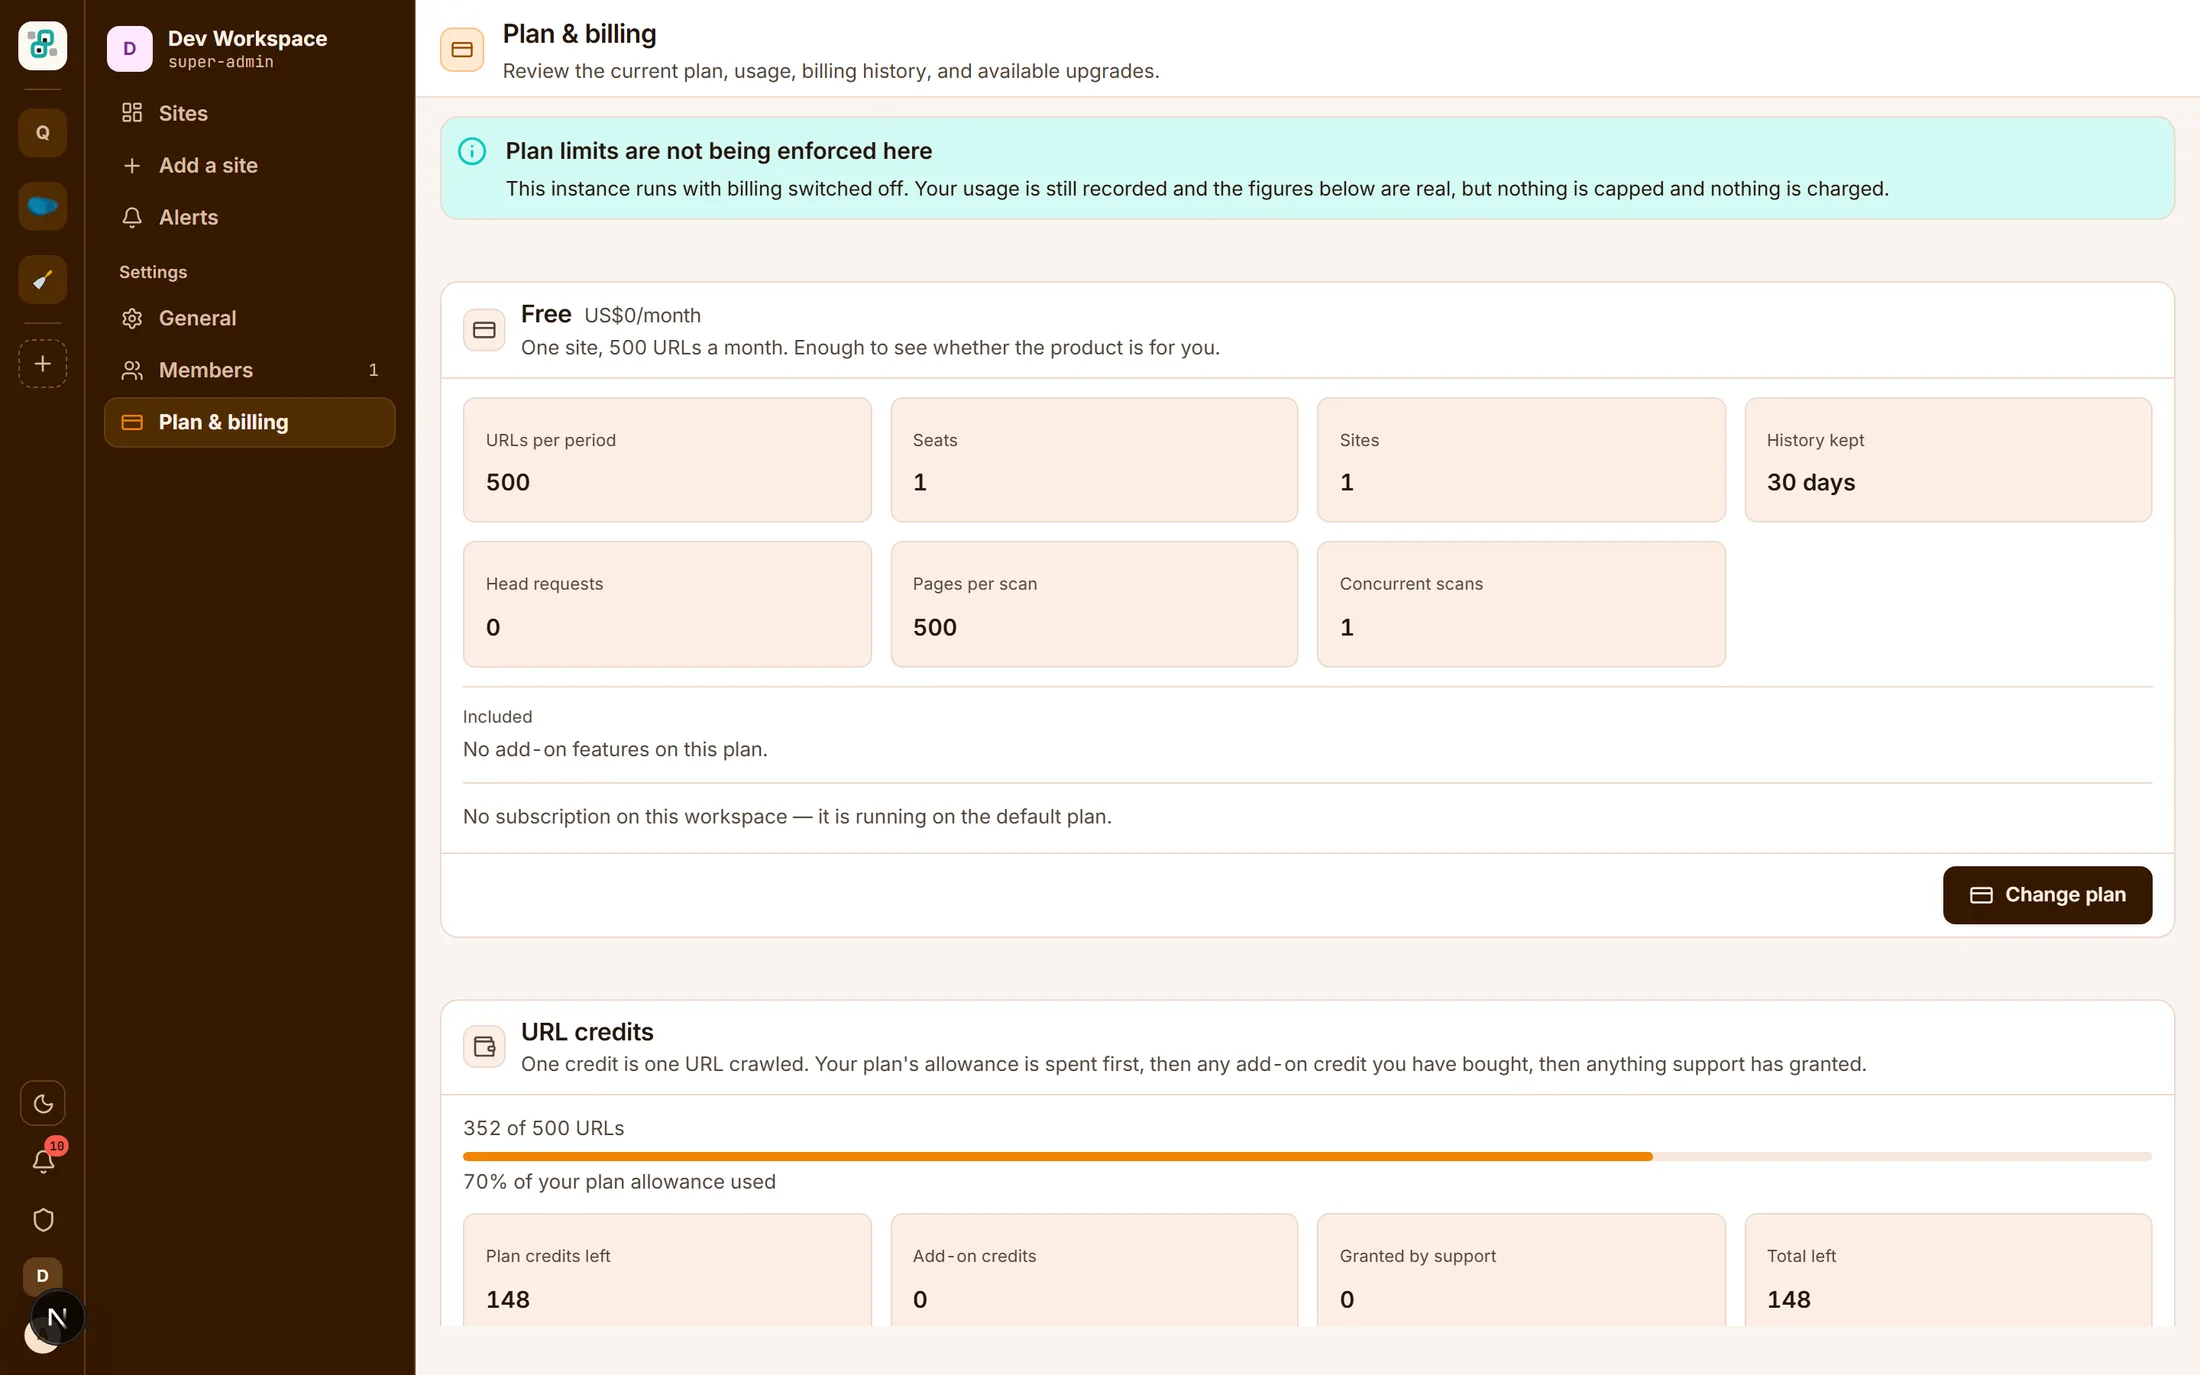
One credit is one crawled URL
The billing screen shows the plan's limits, this period's usage against the allowance, and the three credit balances in the order they are spent: the plan's own, then any add-on credit, then anything support has granted.
- A workspace is the billing subject — three workspaces means three independent bills.
- Cancelling stops auto-renewal; every entitlement is honoured to the end of the paid period.
- A downgrade is deferred to the end of the cycle rather than applied mid-period.
On a phone
The whole product, on the device you have on you
The workspace, a site's health and the issue work list are all usable on a phone — which matters most in exactly the situation the product is for: something has gone wrong and you are not at your desk.
The product
Eleven ways to read one crawl
A scan produces one dataset. These are the questions you can ask of it — every screen below is a capture of the running product, not a mockup.
Understand
Explore
Monitor
Manage
Overview
The site's current health score with its delta since the last run, what broke and what cleared, crawl depth, what the server answered, sitemap coverage and the highest-impact problems — on one screen.
Issues
Every failed check ranked by severity, by how many pages it reaches, and by the score you get back for fixing it. Filter to critical, to one-line fixes, or to site-wide problems, then export the list.
Pages
Every crawled URL with its status code, its findings and its depth from the homepage. Open any one for a full page report.
Structure
How the site is organised — pages, sections, depth and weight up front, then a treemap, a hierarchy diagram and a tree behind the tabs. Largest sections, click depth and structure signals on one screen.
Crawlability
robots.txt and sitemap coverage read side by side, because they contradict each other constantly: a sitemap listing URLs that robots.txt disallows is invisible if you can only see one at a time.
Links
External destinations, repeated links, and every URL that is broken or served insecurely — grouped by the site they point at, or listed one by one.
Images
Every discovered image audited for alt text, dimensions, format and weight, with the pages each one appears on.
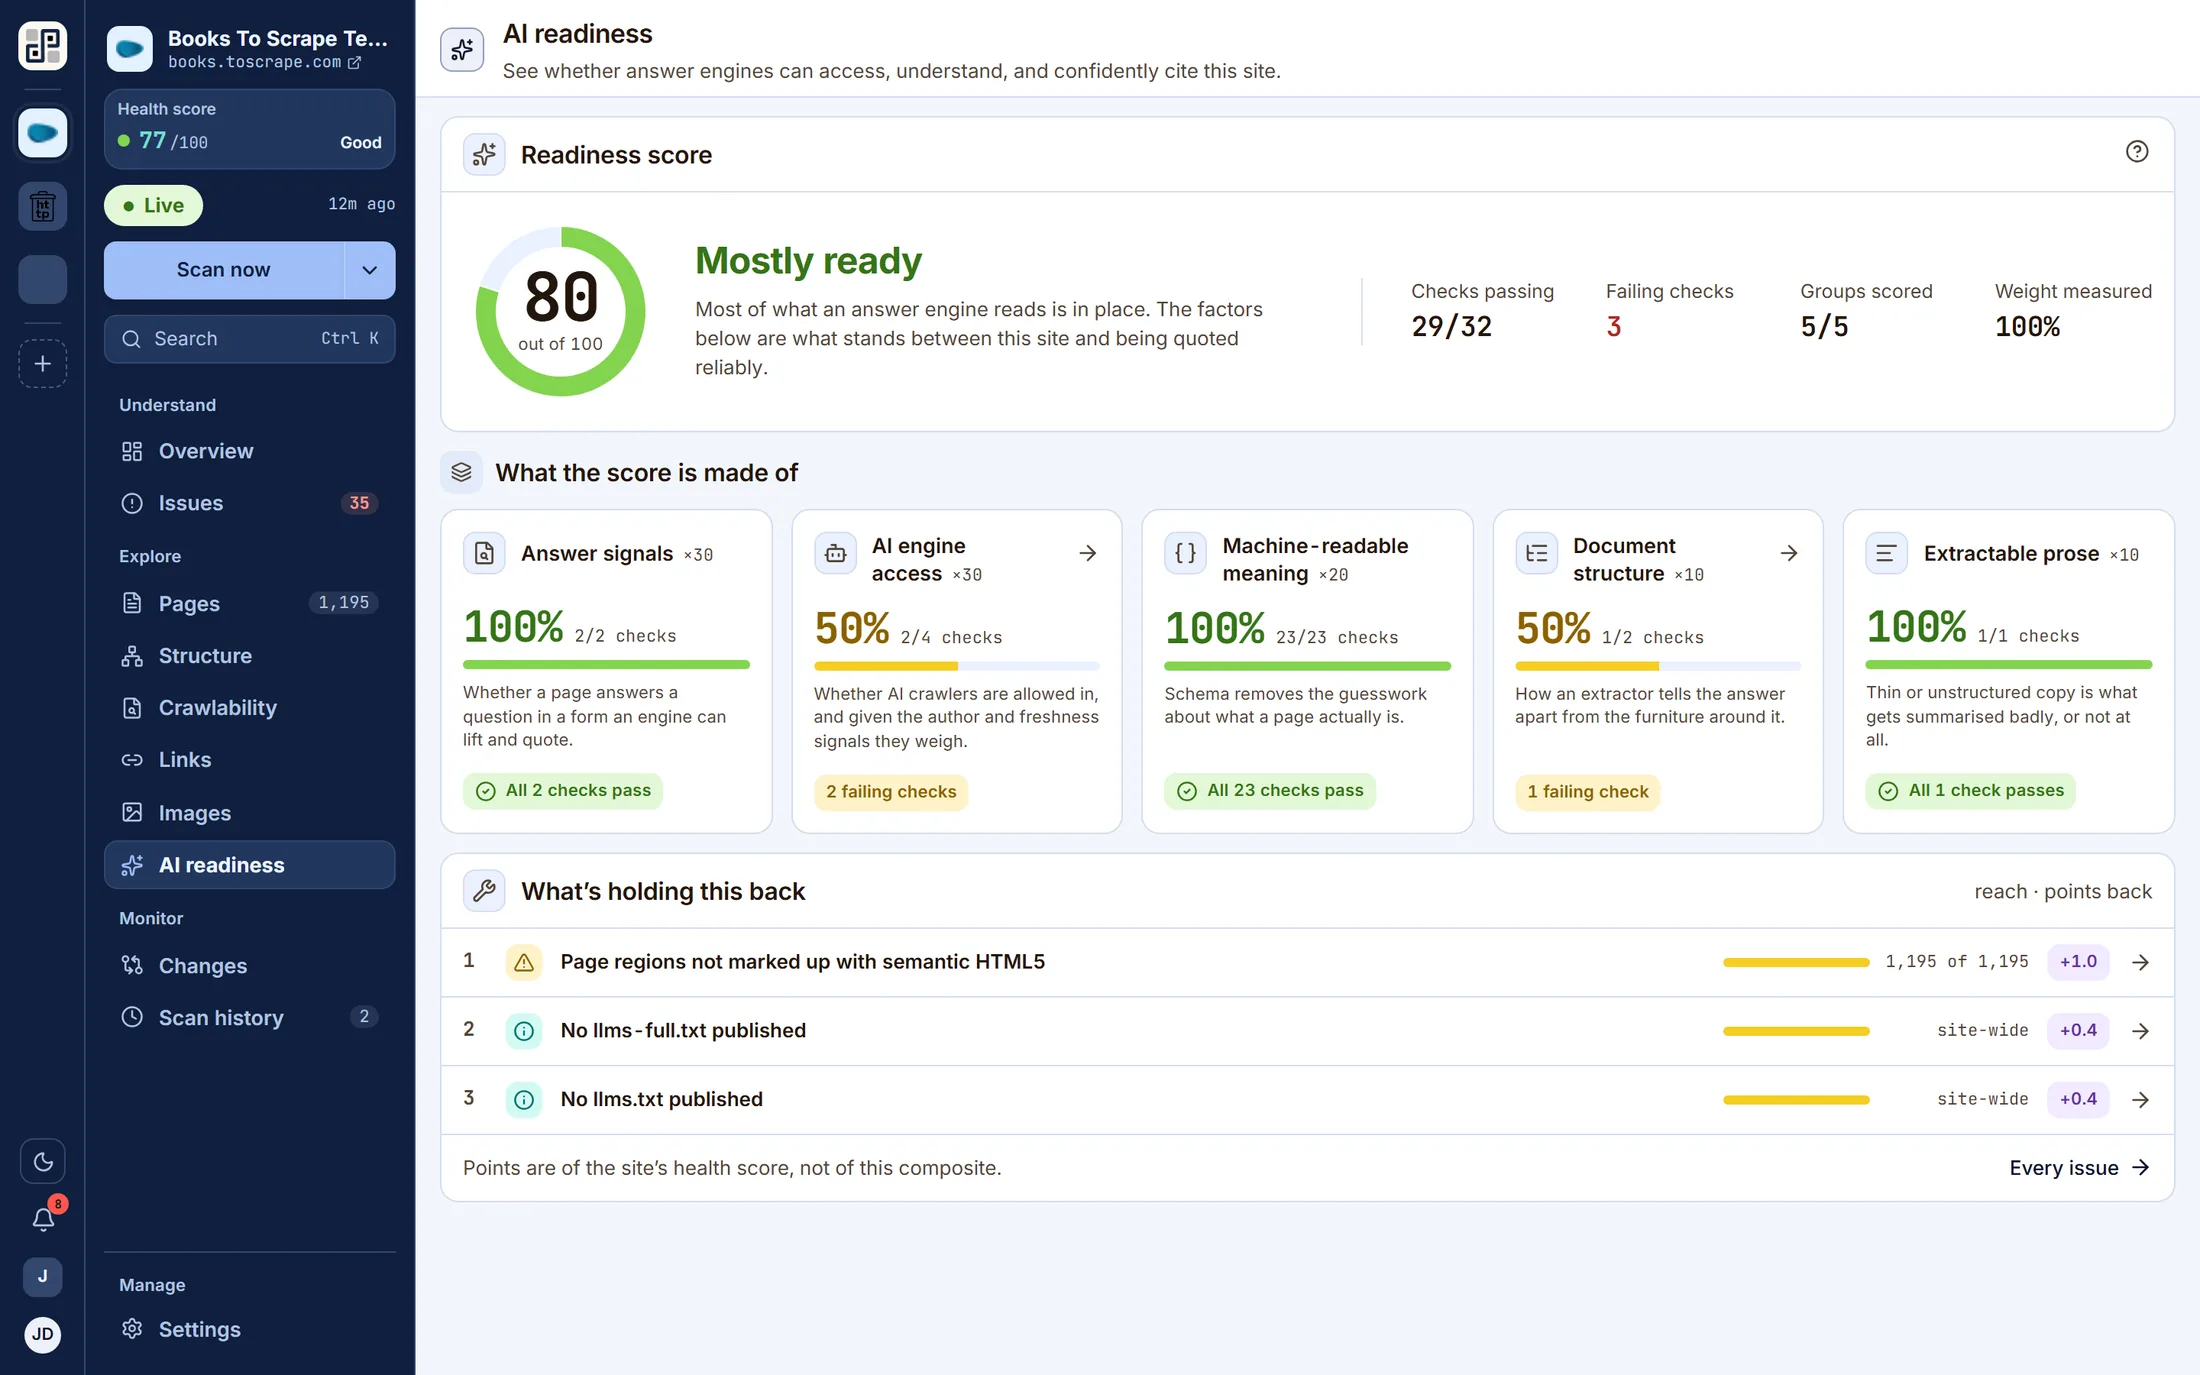
AI readiness
Whether answer engines can reach, parse and confidently cite the site — answer signals, AI engine access, machine-readable meaning, document structure and extractable prose, scored together and weighted.
Changes
What appeared, what was fixed and what persisted since the previous scan on the same branch. This is the screen the product exists for.
Scan history
Every run this site has ever had, with its score, its duration, the branch it measured and the report it produced. Open any one and read the site as it was that day.
Settings
Turn individual check groups on or off, set crawl rules and exclusions, put the site on a schedule, issue a CI/CD secret, and manage who can see it.
Walkthrough
Watch a site go from URL to work list
One crawl, end to end: connecting a site, the scan running, the findings it produces and the comparison against the run before it.
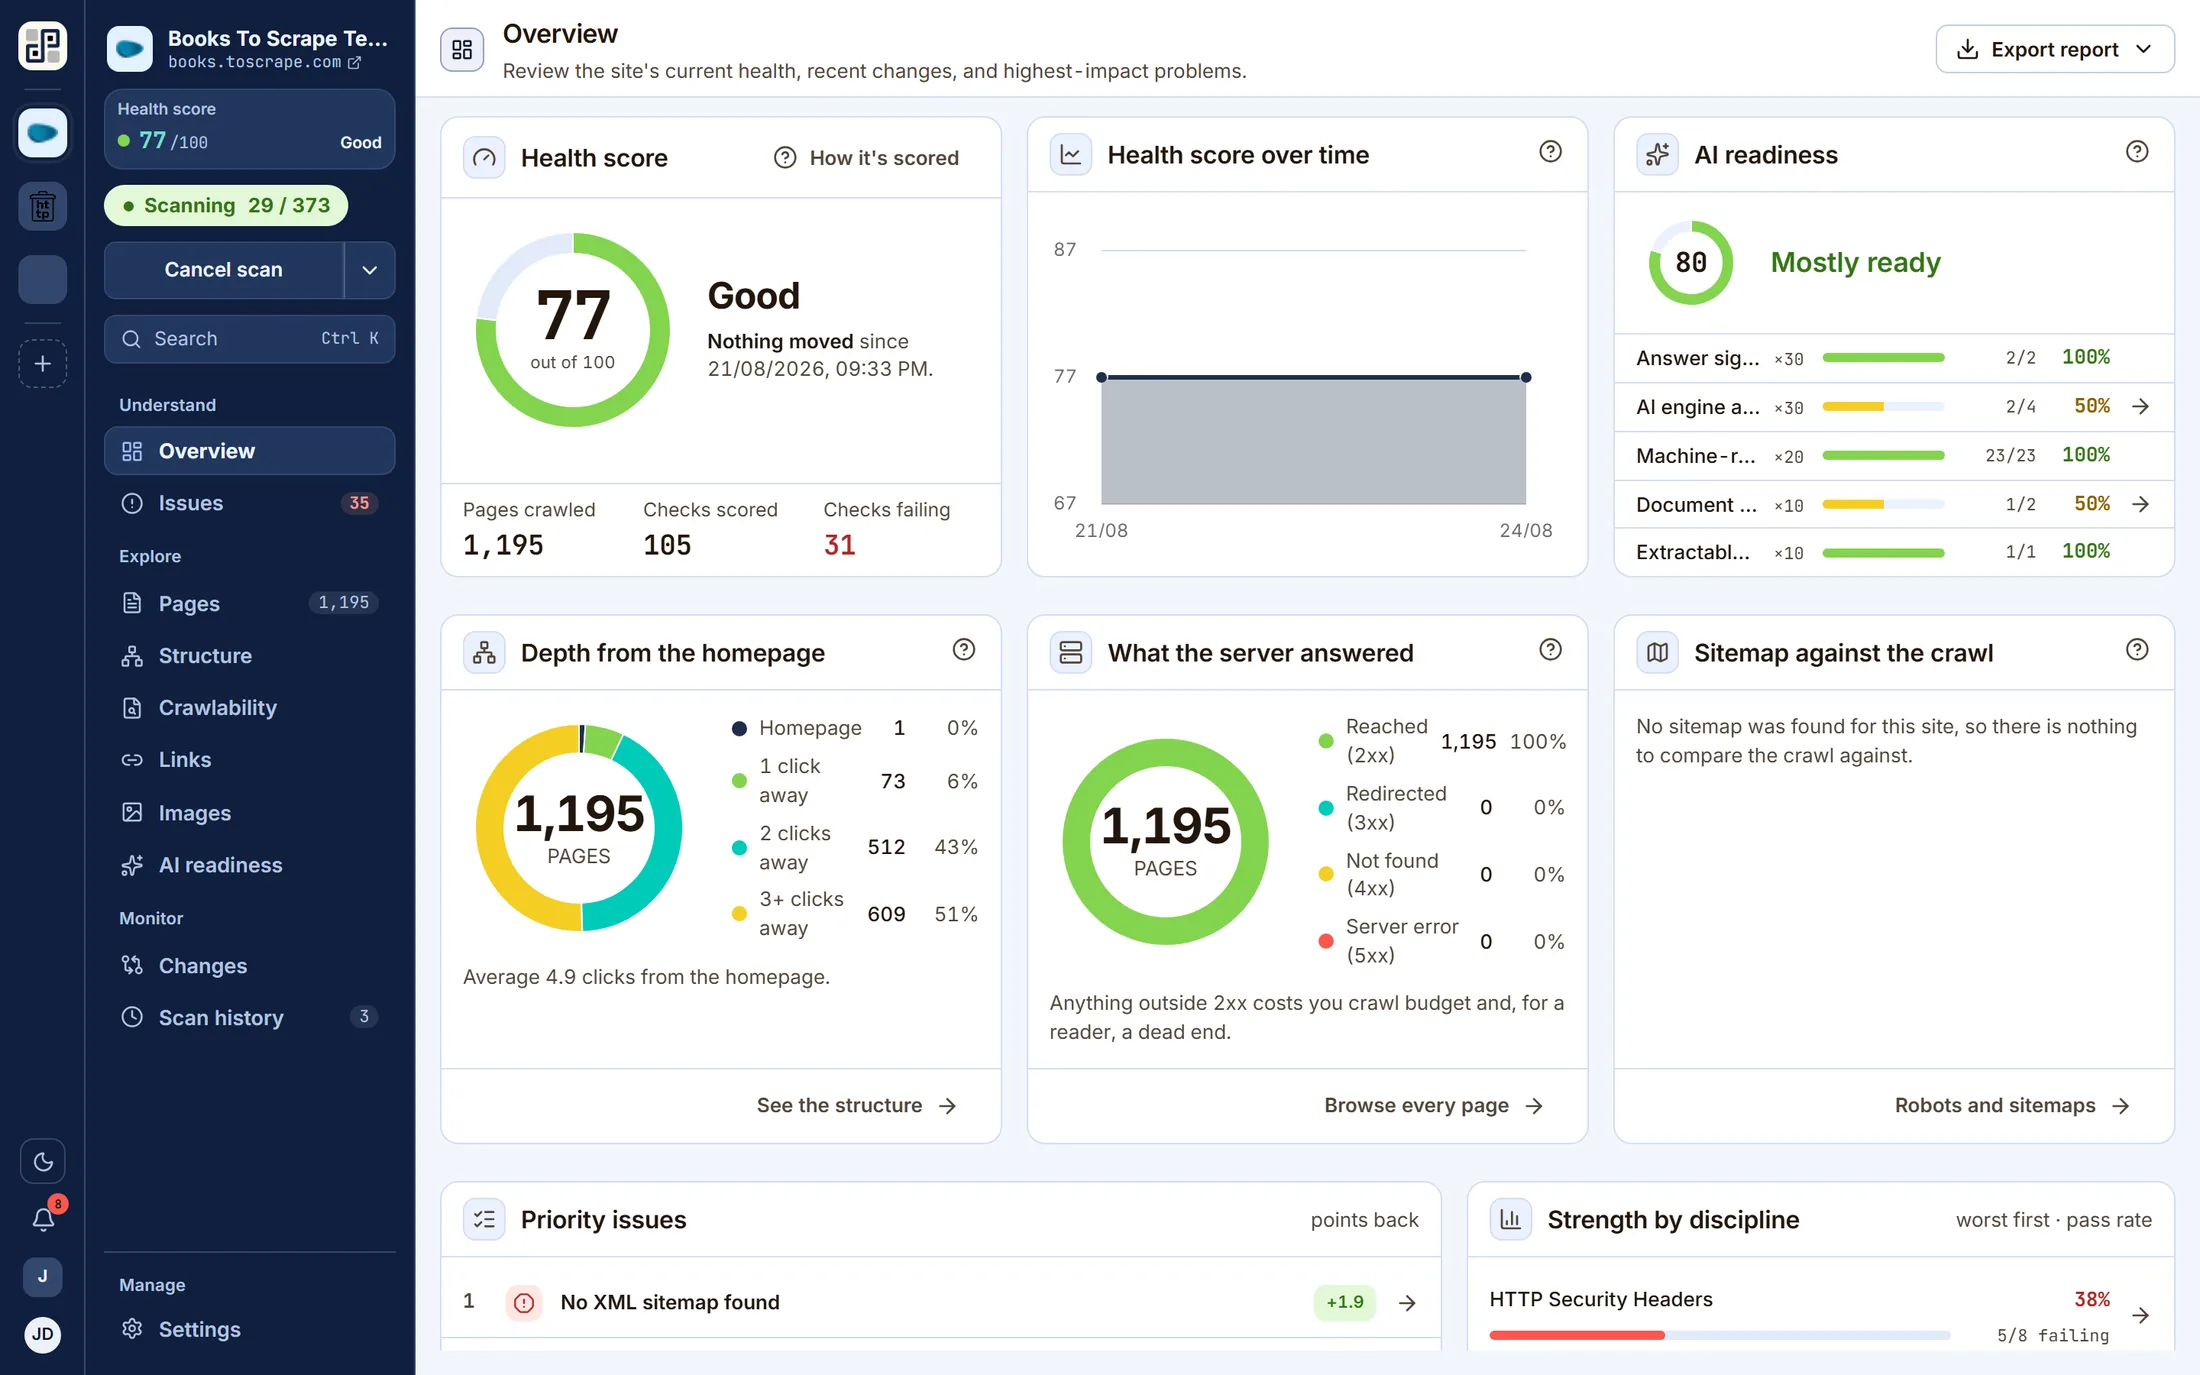
The screen recording is not published yet. Until it is, the still above is the real product mid-crawl, and every screen in the walkthrough is on the product page.
Run one yourselfConnect
Paste a URL, set the crawl limits, choose which disciplines to run.
- 2
Crawl
The crawler reads robots.txt, follows the sitemap and walks the site, streaming progress as it goes.
- 3
Read
A health score, a ranked work list, and a page report for every URL it found.
- 4
Compare
Scan again and the second run is a diff: new, resolved, still open.
See it against your own site
Connect one site free and run a crawl. You will have a health score, a ranked work list and a page report for every URL within a few minutes.
Free plan · 1 site · 500 URLs a month · all 100+ checks · no card